Archives: Resources
Fairtree Market Insights with Karena Naidu | Episode 7: Part 2


Transcript
Karena
Hello everyone, and welcome back to Market Insights, a series where we delve into interesting topics affecting equity markets. Today I have Cornelius and Jacques joining me. Thank you guys for being here again. So Cornelius, the last time we discussed how the US tech stocks have dominated S&P 500 returns, primarily driven by earnings growth. Could you perhaps shed some colour on this.
Cornelius
Yes. So these are amazing companies which are really aggressively reinvesting into their businesses. So if you look at the amount of capital expenditures, percentage of revenues that has doubled since 2015, it has gone from 8% to 15% of revenues while keeping the research and development intensity close to the 15% level. And if we look at the amount of CapEx and R&D in absolute terms, these US tech giants are now actually outspending other capital intensive sectors like oil with Shell and Aramco and Exxon features as well as pharmaceuticals with Merck and Roche and those type of companies are spending a lot of money as well as auto manufacturers like Volkswagen.
So these companies are really investing in their business, and we are seeing a growing contribution from the cloud businesses for companies like Amazon, Microsoft as well as alphabet, and it’s becoming a significant contributor to them because their cloud businesses have tripled over the last six years. And Nvidia is, of course, been a big beneficiary of all this CapEx spend. And if you look at the total earnings growth for these companies, it has continued to grow at a rapid pace. And we’ve recently seen alphabet outstripping Microsoft and Apple in terms of absolute profitability. So the historic growth has been very impressive.
These companies have generated a lot of cash flows and then are reinvesting it into the businesses. If you think about, what multiples you pay for, it’s interesting that the capital intensity depresses the free cash conversion. So arguably the price earnings ratios don’t tell the full story and they’re much more expensive these days on a free cash flow multiple, but on the flip side, you can argue that R&D mustn’t be experienced fully in a given year.
So if you capitalise a portion of that again your price earnings multiples probably overstated. So you have these two different factors that you need to consider. But the fact that these businesses have a lot of growth runway is sure.
Karena
That’s really interesting, thank you. So Cornelius touched on valuations, how expensive are these stocks versus history and the rest of the market?
Jacques
So looking at the valuations of these businesses specifically the price earnings ratios, I think they should be seen in the context of the superior historic earnings growth that these businesses have delivered, but also their future prospects, right. Companies like Google, for example, has derated from more than 20 at the beginning of the year to a 18 and a half forward at the moment, or Amazon wing for more than 32 or 26 forward.
We also don’t think comparisons to the dotcom bubble and the nifty 50 is justified, firstly because the business models is completely different, but also these businesses are now only trading at a 20% or premium to the market compared to the dotcom bubble, where they traded at more than 50 multiples and 100% premium to the market. So therefor think that the valuations of these businesses are reasonable, but we do remain overweight some of the names and underweight others. And we’ve used the volatility provided by Liberation Day in April with a broad selloff in the market to take our US underweight technology business from -7% to equal weight. They’ve rallied quite aggressively now and we’ve used some of this rewriting to take profits.
Karena
Amazing. Thank you so much for those insights on the current positioning in the portfolio Jacques. To the audience, thank you so much for tuning in and we look forward to seeing you next time.
Topics
FAIRTREE INSIGHTS
Your may also be interested in
Explore more commentaries from our thought leaders, offering in-depth analysis, market trends and expert analysis.


Fairtree Market Insights with Karena Naidu | Episode 7: Part 1
Market Insights, an exciting video series where Karena Naidu, Global Investment Specialist, delves into key insights in global equity markets with Equity Portfolio Managers Cornelius Zeeman and Jacques Haasbroek.


Macro Pulse Episode 19
In this episode, Jacobus shares his outlook for the remainder of 2025. He unpacks the current policy environment and its implications for various asset classes, and wraps up with a look at the latest developments in the local economy.

Fairtree Market Insights: Travel Edition Episode 6
Market Insights: Travel edition, where Global Investment Specialist, Karena Naidu discusses travel insights into global markets with Fairtree portfolio managers.
Fairtree Market Insights with Karena Naidu | Episode 7: Part 1

Transcript
Karena
Hello everyone, and welcome back to Market Insights, a series where we delve into interesting topics affecting equity markets. Today I have Cornelius and Jock with me. Thank you guys for being here today. So, let’s kick it off. So, we saw a strong US earnings season with almost 80% of companies beating their estimates. Could we maybe unpack that and spend some time looking into these results.
Cornelius
Is the number north of 80% is the strongest we’ve seen since 2021? The aggregate earnings growth came in just above 12%. And information technology as a sector led the way, with more than 90% of companies beating earnings estimates. All the big tech companies delivered very robust results with Microsoft, Apple, alphabet, Amazon, everyone reporting very strong results and giving positive outlook statements.
Some of the shares were rewarded with share price moves up 8%. Amazon got clapped a bit because cloud growth came in weaker than the market wanted, but still very strong results. If you think about the extent of the earnings beat just over 8% earnings surprise, which means the earnings came 8% ahead of consensus. That is in line with the five-year average.
It’s custom for US companies estimates to come in high at the start of the year, then get downgraded then the companies come in and beat, quite comfortably. So, 8% isn’t something new. Interestingly, we saw consumer discretionary as a sector beating by 14% in aggregate, which shows that the US consumer is in a much better space than people expected.
And we can also see if we look at the amount of references to recession that completely dropped off the normal levels, where everyone was quite nervous in, Q1 reporting season, just, of the Liberation Day. Almost a quarter of companies spoke about the recession this time around, six sectors there were no companies actually mentioning recession.
If we think about the guidance that the companies provided, more than 60% of the companies issued positive guidance which means the earnings that they’re guiding the market, is ahead of what consensus is pencilling at the moment and there you have a mixed bag, industrial companies are actually issuing strong guidance as well as healthcare. And then by far the most positive mix is information technology.
Karena
Brilliant, thank you for that colour. That was really informative. So we’ve seen really strong earnings growth and guidance coming out of the infotech sector, but that’s not something new is it Jacques?
Jacques
No. So taking a bit of a step back following the earnings recession that the Mag7 companies went through in 2022 with the pullback in spending, we’ve seen very strong growth delivered by the mag7 over that period and using 2024 as a base we can see that they’ve delivered more than 30% upgrade to earnings of both 2025 and 2026 calendar years, which is opposite to what we’ve seen from the S&P 493, where they’ve had between 5 to 10% downgrades in their earnings. So, looking at the total shareholder returns for the year, very similar to last year where it’s been driven predominantly by the Magnificent Seven, which roughly falls within information technology and communication, and again driven by the superior earnings growth posted by those businesses. Four of the sectors actually posted negative earnings growth while benefiting from a rerating that’s driven the total shareholder return.
Karena
Brilliant, thank you Jacques. Please feel free to join us for our next session, where we’ll unpack the information technology sector in a bit more detail. Thanks so much.
Topics
FAIRTREE INSIGHTS
Your may also be interested in
Explore more commentaries from our thought leaders, offering in-depth analysis, market trends and expert analysis.

Fairtree Market Insights with Karena Naidu | Episode 7: Part 2
Market Insights, an exciting video series where Karena Naidu, Global Investment Specialist, delves into key insights in global equity markets with Equity Portfolio Managers Cornelius Zeeman and Jacques Haasbroek.
Macro Pulse Episode 19
In this episode, Jacobus shares his outlook for the remainder of 2025. He unpacks the current policy environment and its implications for various asset classes, and wraps up with a look at the latest developments in the local economy.
Fairtree Market Insights: Travel Edition Episode 6
Market Insights: Travel edition, where Global Investment Specialist, Karena Naidu discusses travel insights into global markets with Fairtree portfolio managers.
Macro Pulse Episode 19

Transcript
Hello and welcome to Macro Pulse. This week we’re going to look at monetary policy and look at some of the extraordinary developments we’ve seen both in local and global central bank policy. But first, why is monetary policy important? Well, it says interest rates, which influences the cost of capital, credit conditions and the flow of money between savings, consumption, investment between different countries around the world. So, monetary policies are key variable in analysing macro trends.
Let’s start with the US. The US typically follows a dual mandate between price stability as well as maximum employment, meaning inflation and growth. On the growth side, the US economy has weakened to below trend. When we look at recent consumer numbers, they’ve weakened. That includes the most recent jobs number, the monthly jobs number that we saw for the month of July.
It showed that due to some really big downward revisions, the three-month average job gain over the last three months now is 33,000 jobs per month, which is the weakest level. It’s been since the pandemic. These numbers were so bad that Trump labelled them rigged, and he fired his head of the rule of labour statistics, and the person that’s supposed to replace her has said that he will stop producing the monthly job numbers until they’ve been corrected.
So, this obviously brings in some complications for the fed, which has become increasingly more data dependent. But the fed is also fighting fights along independence in the sense that Fed Chair Powell continues to be criticized by President Trump, is now a lawsuit, potentially, that will go after, Fed Chair Powell for his role in the increasing cost of the renovation of the fed building.
Scott Pearson, the Treasury Secretary, has also called for, Powell to reduce rates by 50 basis points. At the next meeting. During the last FMC meeting, Jay Powell indicated that the reason for not cutting interest rates is because of the uncertainty that has come along with the trade tariffs. And so, putting the blame to some extent on the Trump administration, if you look at the inflation numbers, they are around 3%.
And when you look at the most recent print, it does look like core goods inflation continue to rise as the import prices continue to increase from these increased tariffs. However, the pass through has been fairly slow and fairly weak. And so, some of the fed members are willing to look through these increases and are starting to talk about rate cuts.
The market now prices in the 25 basis points rate cut at the next meeting in September. But if we indeed see a little bit more weakening in the US data, we could see the market starting to call for 50 basis points at the next meeting. And in September. However, what we have learned from the central bank history is that central banks, and particularly the fed, typically waits too long before they start cutting interest rates.
And then ending up having to cut faster and deeper than initially anticipated. One central bank that has been proactive has been the ECB. They’ve cut rates now to 2%. Inflation has come down to around 2%. And along with the increased certainty now that tariffs have been set at 15%, some of the sentiment has improved. And you see that in some of the economic data points.
That has also improved. This weekend they will be meeting between Putin and Trump in Alaska. And that could still have an impact on European assets. So, one that we watch closely. The Bank of England also had a very interesting meeting. They voted twice. The first time that a split vote of four for one, which means four members voted for hold, four for a 25 basis points cut, and another member voted for 50 basis points cut.
It kind of shows you the uncertainty even within the central bank, is that typically, since with exposure to many economists around them, in trying to figure out what is happening from a growth and inflation perspective in these respective countries, after the second vote, they voted for 25 basis points, cut. But Governor Bailey has been quite hawkish in indicating that they can’t be premature in cutting interest rates.
And it is still a lot of uncertainty around the inflation outlook locally in South Africa. We also receive the 25 basis points cut the market expected to 25 basis points cut. That was less of a surprise but was a surprise. However, was the announcement by the governor that the Salt will, in the future conduct monetary policy in a way that targets the lower end of the inflation band, the inflation band sitting between 3 and 6%, and so they will target 3%.
Now this is not an official announcement of the change in the inflation target. That has to come from the finance minister, which hasn’t indicated yet when he will do so and what the new inflation target will be. They are still looking at achieving political consensus at this stage, implicitly. The Sarb is targeting 3% as an inflation target, which does bring in some complications in that bond, your policy in fiscal policy is not aligned in terms of the inflation outlook, fiscal policy. Think about setting wages, for instance, and making adjustments for wage growth is now still looking at a 4.5% fall. Monetary policy is looking at 3%. This is unsustainable for a prolonged period. And so we expect the finance minister to come in in the next few months to also, adjust the inflation target officially to the lower end.
We think with inflation still low but slightly rising, there’s still scope for the Sarb to cut interest rates maybe once more in this cycle before it starts with a pause to see if inflation expectations and inflation indeed comes down as they would want. Finally, the in China there’s the central Bank of China. The PBoC is also still set to lower funding costs.
The recent Politburo meeting in July indicated that authorities still look to reduce funding costs. Now the economy is soft, but it’s not terribly weak, and therefore authorities does have some time to use targeted policies to improve growth, and to support the local consumer. In summary, central banks could therefore be categorized in one of two camps the first camp and predominantly the fed, maybe also the UK to some extent, but the fed where inflation is still fairly sticky at around 3%. Fighting the central bank independence. But ultimately growth is slowing down from a higher level, and the fed and the UK will have to cut interest rates. The second camp is more that of the ECB. Some emerging market central banks, including the PBoC in China and this African Reserve Bank, where inflation is low. We have seen some rate cuts already taking place, but there’s potentially more scope for easing to support growth from a low level.
And we believe and we want to favour more cyclical exposure in those countries, we central banks said in camp two, where inflation is low, we could potentially see a little bit more from an easing perspective to support growth. All of these dynamics also mean that the US dollar is weakening, as real rates in the US is coming down as a result.
But also, we said with increased policy uncertainty in the US relative to other markets, this has been favourable for emerging market currencies, including the South African rand, which is one of the best performing currencies. Over the last month and over the last year, along with many emerging market currencies, has appreciated by between 5 and 15%, which is also driven down inflation dynamics.
This improvement in rand is largely being driven by an improvement in terms of trade, the prices of goods that we export, predominantly commodities. 50% of our exports as commodities, they are rising in price, while the prices of the goods that we import, in particular energy, 20% of our imports is energy. They are falling in price or the prices remains fairly low.
And that positive terms of trade, leads to an improvement in the rand. This improvement in the rand also has got implications for South African assets. In particular, African equities have been a defensive play relative to global markets over the last one year, two year and five years, South African equities have outperformed US and global equities in rent terms.
That’s all for this week. Thank you for watching.
Topics
FAIRTREE INSIGHTS
Your may also be interested in
Explore more commentaries from our thought leaders, offering in-depth analysis, market trends and expert analysis.
Fairtree Market Insights with Karena Naidu | Episode 7: Part 2
Market Insights, an exciting video series where Karena Naidu, Global Investment Specialist, delves into key insights in global equity markets with Equity Portfolio Managers Cornelius Zeeman and Jacques Haasbroek.
Fairtree Market Insights with Karena Naidu | Episode 7: Part 1
Market Insights, an exciting video series where Karena Naidu, Global Investment Specialist, delves into key insights in global equity markets with Equity Portfolio Managers Cornelius Zeeman and Jacques Haasbroek.
Fairtree Market Insights: Travel Edition Episode 6
Market Insights: Travel edition, where Global Investment Specialist, Karena Naidu discusses travel insights into global markets with Fairtree portfolio managers.

Moby bikes
Moby is a multi-modal bike-as-a-service business that runs B2B and B2C mobility businesses in Ireland and the Netherlands, with leased assets for restaurants and delivery riders, as well as operating city contracts for consumers. We acquired a stake in Moby through their acquisition of our portfolio company Cargoroo in 2025.
FAIRTREE INSIGHTS
News and Insights
Explore a wealth of knowledge from our thought leaders, offering in-depth analysis, market trends, and expert commentary to help you navigate the evolving financial landscape.

Moby bikes
Moby is a multi-modal bike-as-a-service business that runs B2B and B2C mobility businesses in Ireland and the Netherlands, with leased assets for restaurants and delivery riders, as well as operating city contracts for consumers.

Fairtree Capital acquires minority share in MidSquare Capital
Fairtree Capital, the South African holding company of the local Fairtree group of companies, is pleased to announce that it has acquired a minority equity investment in cryptocurrency and decentralised finance asset management business, MidSquare Capital.

Perspective: Energy
Throughout human history, economic growth has been driven by population growth and productivity per person.

Perspectives on artificial intelligence
Artificial Intelligence (AI) is a term used rather loosely, but at its essence, it can be used simply as an umbrella term for strategies and techniques you can use to make machines more human-like.
We are Fairtree
Subscribe to our newsletter
Stay informed with the latest insights and updates. Subscribe to our newsletter for expert analysis, market trends, and investment strategies delivered straight to your inbox.

"*" indicates required fields


21 August, 2025


Thursday, 08-21-2025 at 12:00 am
How to enter

Pick a number from the Fairtree family tree.

Snap your photo and place it on the tree.
Scan the QR code to enter your lucky number.
We see beyond the numbers by investing in the value of real relationships.
At Fairtree, we see beyond the numbers. We understand that behind every retirement fund is a promise to real people – to protect and grow their hard-earned savings for a secure future. By building trusted partnerships, we navigate complex markets together, delivering consistent, long-term results that honour that promise.
Submit your answer
Complete this form for a chance to win one of five Freedom Of Movement prizes.
"*" indicates required fields
Our team
We pride ourselves on our acclaimed specialist teams, as well as our tried, tested and proven risk and portfolio management processes.

Jacobus Lacock
Multi-Asset Portfolio Manager & Macro Strategist

Simon Ulamba
Country Manager: Namibia

Dave Uirab
Portfolio Analyst & Distribution Officer
Contact us


Fairtree Global Flexible Income Plus Fund Q2 2025 Commentary
Market dynamics
Global risk
After the very slow start for US equities during the first quarter, and the superior performance emanating from the EU and the UK, the second quarter witnessed a turnaround in fortunes with the tech-heavy NASDAQ delivering its fourth-best quarterly performance number over the past 18 years. It delivered an eye-watering 17.97% as global investors came to the realisation that the impending collapse of the US economy due to the so-called “Tariff Wars” was not coming to fruition. The broadly based S&P 500 delivered 10.94%, whilst the Large Cap Dow Jones Industrial Average showed investors a still healthy 5.46% during the period. Moving across the pond, it was a much more sombre time for the FTSE 100, which rewarded risk takers with a sound 3.15% as the global bounce in risk was somewhat offset by market-unfriendly noises emanating from the current UK government. European equities sputtered, with French equities delivering sub 1% – a rather uninspiring number.
Table 1: Major Index Q2 2025 Total Return and historic rankings Q2 2007 – Q2 2025
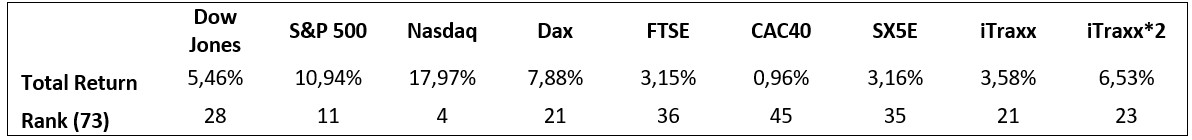
Source: Bloomberg, 30 June 2025
Moving to European credit, the iTraxx suite of indices produced another set of numbers that were quite meaningful. The iTraxx Crossover 5-year Total Return Index produced a rather splendid 3.58% which outperformed European equities on an outright basis. Our more favoured 2 times levered index, a more realistic measure of the relative performance of European credit, produced a healthy 6.53% for the quarter. We have consistently stated that in the absence of meaningful defaults, the iTraxx Crossover suite remains a good compromise of risk and available returns, and we feel that the index on a levered basis should offer a better risk-adjusted opportunity to investors who are willing to accept an excess premium to insure company credit. This aversion to catastrophic loss is probably the main driver of the very excess returns that the indices have produced since inception. One could suggest that the return to normality might undo this excess return, but our view is that the average investor has little to no appetite for taking such a risk. This play ensures that the risk premium remains elevated and is the very reason for the persistence of this excess return through time.
Given the fact that we have over 18 years of quarterly data, we can do more than just look at the outright performance numbers as well as the relative rankings. We can also have a look at relative risk measures such as standard deviations, Sharpe Ratios and other measures of risk-adjusted returns. This should be important to investors who do “feel” risk in the diffusion of the performance that they have been delivered. For the same absolute return in a portfolio, only a fool would be happy with more risk for that return than less risk. There are many definitions of what risk is, and what is important for one investor is quite different from another, but we feel that the most consistent and comparable is the time-tested standard deviation, which has its roots in its underlying mathematical construct. This makes it consistent in its treatment of any distribution of potential outcomes. The simple calculation of mean divided by standard deviation gives a good measure of risk-adjusted return and is one that we tend to like to look at. This is not the Sharpe Ratio (SR), as the SR strips out risk-free return as well as the volatility of that risk-free return, but we feel that the basic return per unit risk ratio is a good proxy for the slightly more rigorous SR. Obviously, a higher number is better as the investor receives more return for their accumulated risk. We must be aware, however, that a high number on its own cannot be viewed as the “Holy Grail’ since any low volatility index might deliver high levels of Return Coefficient but might not deliver that much by way of return. By way of an example, it might be foolish to buy an index that produces a 0.4% annual return with 0.2% annualised volatility – a return coefficient of 2, rather than an index that produces a 12% return with a standard deviation of 8%.
Table 2 shows the annualised returns, the annualised risk, as well as the return coefficients for the major indices that we monitor. These numbers are generated from our historic dataset and therefore do include risk periods such as the global financial crisis (GFC), the Greek government default crisis, the COVID-19 global pandemic, the more recent Ukraine/Russian war as well as the current war in the Middle East and all the political turmoil in Europe the UK and the United states. Perhaps it is more of the same rather than the exception at the moment, with the world (as usual) teetering on the brink of the potential for some financial fallout, but the traditionalist would suggest that this potential for fallout is the very reason that risk premia exist in the first place. No risk should have risk-free returns; those who choose to take the risk of loss should surely be rewarded for doing so. This line of argument would go a long way in explaining persistence in market returns. The “overvaluation” of US equities has been bandied around for the last two decades, and yet they continue to outperform their European counterparts. Contrary to popular opinion, the outperformance will more than likely continue until participants accept it as the “new normal”, and when that eventually happens, it will probably be followed by a reversal of fortunes. The relative outperformance of Europe over the first quarter of 2025 was indeed reversed during the second quarter of 2025. From a European perspective, Table 2 highlights the outperformance of credit from a risk-adjusted perspective. In fact, the more risk normalised two times levered index solidly outperforms its equity equivalent, offering investors excess return for a given risk target. If an investor is comfortable with equity-type risk, he/she should be more than happy with the extra return that iTraxx*2 has offered. This index goes a long way to close the relative gap to US equities.
Table 2: Index risk-adjusted return coefficient
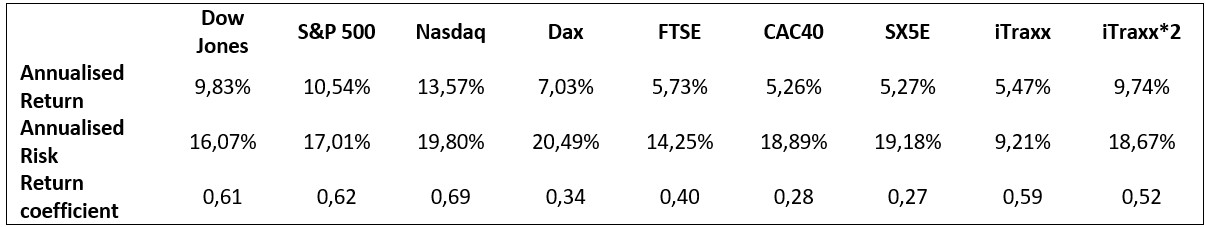
Source: Bloomberg, 30 June 2025
As an extension of the last quarter’s report, Figure 1 below shows the cumulative return of the various indices in the currency of the particular index domicile. The various performance traces have been indexed to 100 at the beginning of the second quarter of 2007, when we had the complete historical data for the iTraxx XOver and Main total returns.
When looking at Figure 1, it also becomes apparent that there are no returns to risk-free. The worst-performing traces over the 18 years are the iTraxx Main Index (125 equally weighted global investment grade credit names) and the US Treasuries total return index. Looking at the delivered risk, it becomes apparent that US Treasuries are not the least risky asset class but rather the well-diversified investment grade CDS index – iTraxx Main. They have generated the lowest returns coupled with the lowest associated risk over the past 18.25 years.
Figure 1: Major Index Total Return Q2 2007 – Q2 2025
Source: Bloomberg, 31 March 2025
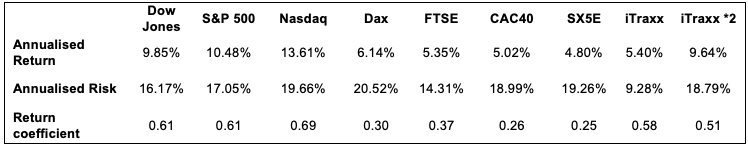
As an extension of last quarter’s report, Figure 1 below shows the cumulative return of the various indices in the currency of the particular index domicile. The different performance traces were indexed to 100 at the beginning of the second quarter of 2007, when we had the complete historical data for the iTraxx XOver and the main total returns.
Figure 1 also shows that there are no returns to risk-free. The worst-performing traces over the past 18 years are the iTraxx Main Index (125 equally weighted global investment-grade credit names) and the US Treasuries total return index. Looking at the delivered risk, it becomes apparent that US Treasuries are not the least risky asset class but rather the well-diversified investment-grade CDS index—iTraxx Main. They have generated the lowest returns coupled with the lowest associated risk over the past 18 years.
Figure 1: Major Index Total Return Q2 2007 – Q1 2025
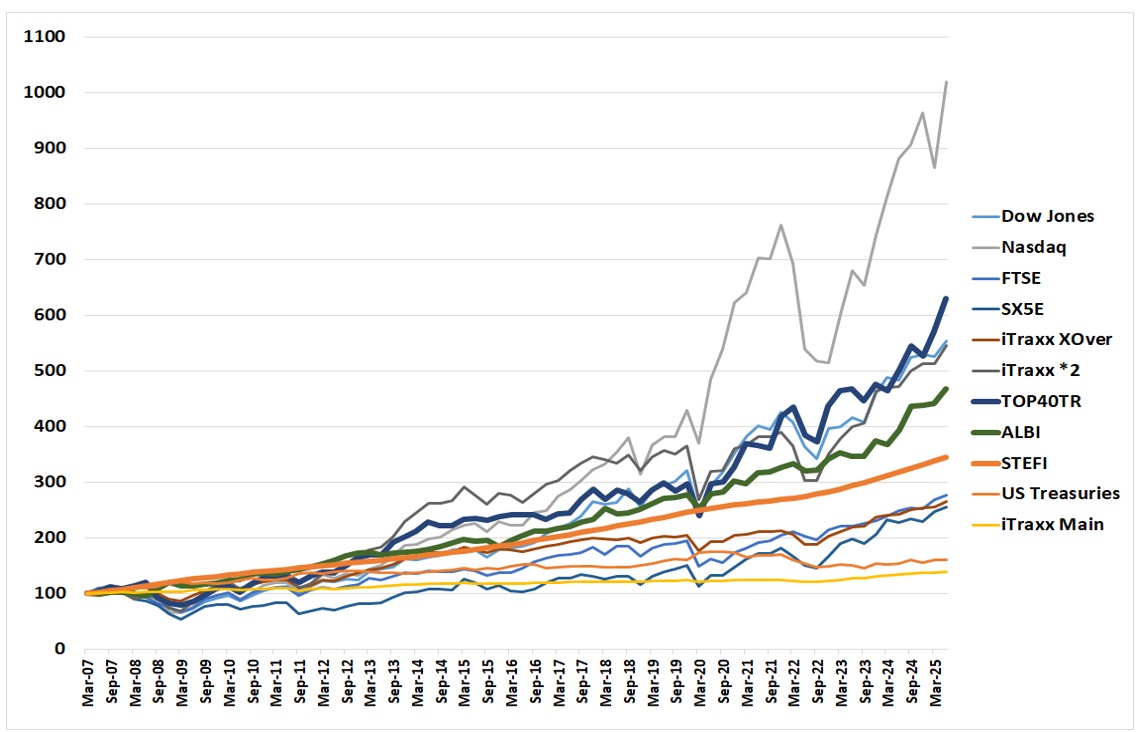
Source: Bloomberg, 30 June 2025
It is difficult to look at the returns and the associated volatility of those returns simultaneously in Figure 2. To disentangle the graphic and the more meaningful comparatives, we produce the delivered risk (as computed by the annualised standard deviation of quarterly returns) as well as the delivered annualised return over the 18 years. This is shown in Figure 2. If we were to fit a straight line to this dataset, we would observe an upward slope, indicating that there is a positive return to risk. Increase that risk, and it should result in a higher delivered return. The corollary of this is also apparent: a reduction in risk taken will result in a reduced overall delivered return. The textbooks, which have always stated that there needs to be an excess return to risk, are indeed correct. The short run is deemed to be random, whilst the longer run will yield excess return due to the extraction of the various risk premia. As time elapses, the risk premium (or positive slope) becomes more apparent. One heuristic would be that the short run is randomly distributed around a mean and variance, whereas the longer run is an equally weighted “portfolio” of those independent periods. Thanks to the only free lunch in finance, i.e., the Central Limit Theorem, the long-run results in a normally distributed outcome centred on the delivered risk premium. Mathematics delivers to investors that which economists can only posit.
Figure 2: Major Index Risk Return scatterplot Q2 2007 – Q2 2025
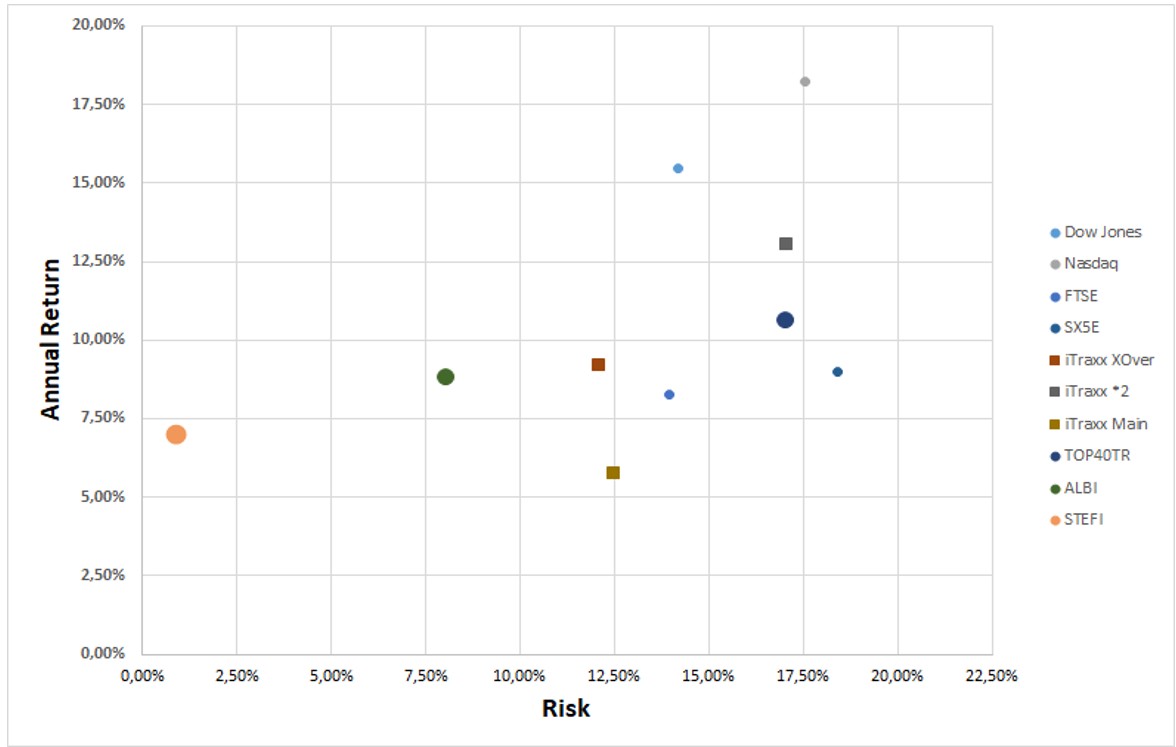
Source: Bloomberg, 30 June 2025
The domination in return terms of US equities, which was touched on earlier in this piece, is quite apparent in the figure, but one must be cognizant of the fact that these indices are shown in local currency.
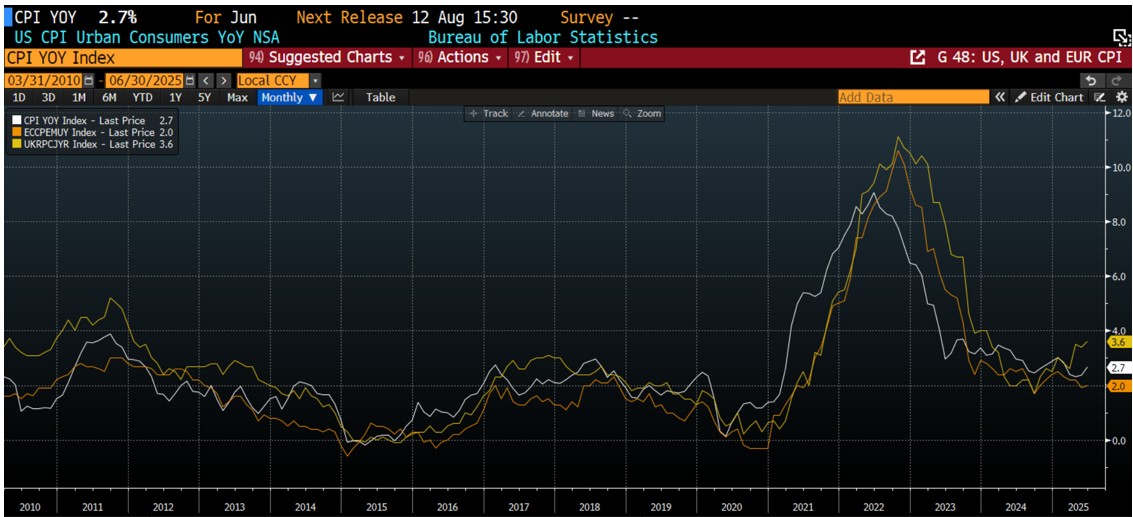
Moving to the economic backdrop, Figure 3 shows inflation in the developed world (US, UK and Eurozone), highlighting the fact that inflation is well off its highs hit in the 4th quarter of 2022. The fact that the disinflationary trend, which started in the US, seems to have slowed down and even tacitly reversed a tad, has resulted in a more cautious response from the Federal Reserve. Although the Eurozone has hit its inflation target of 2%, resulting in interest rate relief from the European Central Bank, the question remains as to the stability of inflation going forward around that target. We would contend that inflation itself is a global rather than localised phenomenon, with the major driver of inflation being the overall pressure in global input prices rather than localised output prices. We therefore need to witness US inflation reducing further in order to see a continuation of the more recent gains in the reduction of European inflation. This does leave the ECB with fewer degrees of freedom going forward.
Figure 3: Annual change in Consumer Price Indices March 2010 – June 2025, US, UK and the Eurozone
Source: Bloomberg, 30 June 2025
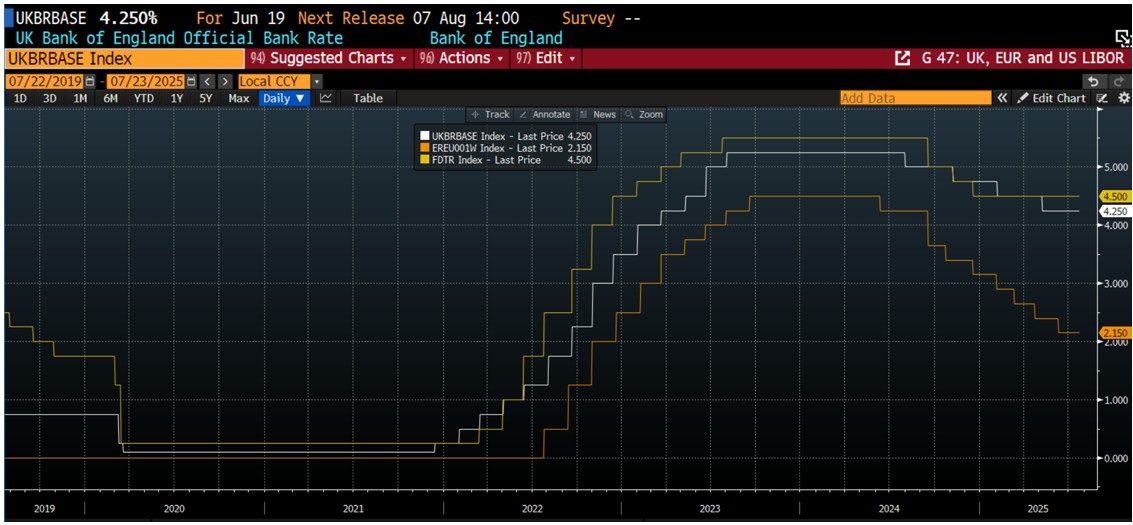
Figure 4 below shows the level of short rates as administered by the US Federal Reserve, the European Central Bank and the Bank of England. What is of interest to note is the high levels of correlation in both the direction as well as the extent of policy movement. The other point to highlight is that the response from the ECB has been the most aggressive in terms of timing and extent. The ECB was the first to start cutting and has cut the most since the beginning of the cycle at the end of May 2024. So far, the ECB has cut by some 235 bps, whilst the Fed has only cut by 100 bps, which is the same as the BOE. As was previously stated, the excessive end of Q1 pricing of US Federal Reserve action has been largely factored out of the market with Fed Funds Futures only pricing in some 50 bps of cuts by year-end, which has much more realistic optics than the 100-125 bps that were priced in at the end of April. Arguably, a lot has happened since then, but with US headline inflation stabilising in the high 2% context, it is difficult to justify aggressive action from the Fed so long as inflation is markedly higher than the unofficial target of 2%. Again, this highlights very little in the way of wiggle room for the ECB to continue its cutting cycle.
Figure 4: Central Bank Administered Rates
Source: Bloomberg, 31 March 2025
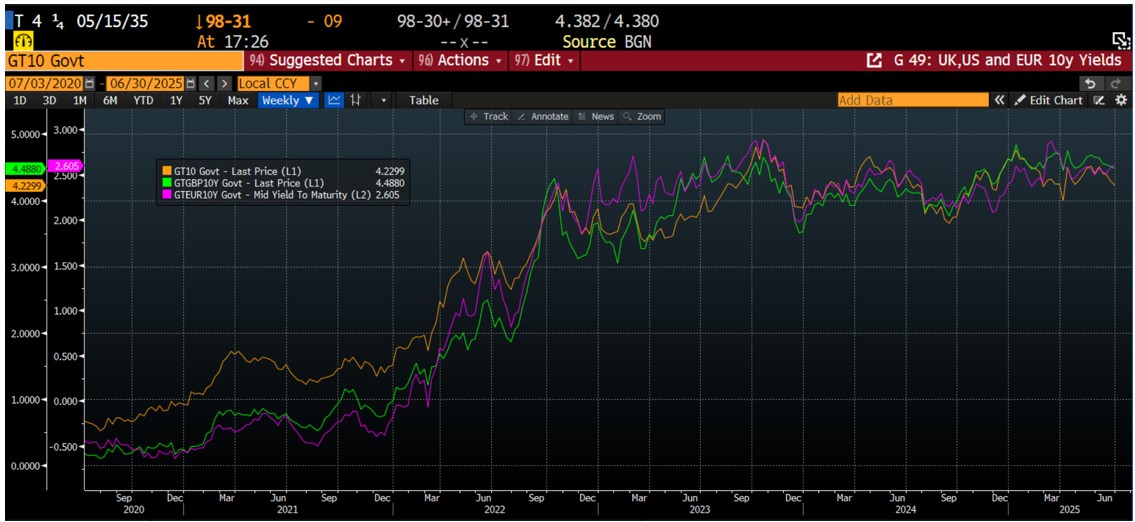
The movements in global bond yields are shown in Figure 5. The 10-year US Treasury, the UK Gilt and the 10-year benchmark European Bund are shown in the Figure, albeit using 32 different scales. It is interesting to point out the high levels of correlation between these three traces, and although short-term disconnects tend to take place, they generally are swiftly reversed. Bearing this in mind, one can see that the current yield on the generic 10-year bund is about correct. The other very interesting point to make is that the whole “Trashing of the UK GILT market” due to the appointment of Liz Truss on 6 September 2022, which finished some 49 days later, actually is unobservable in the figure. In other words, the mainstream media ascribed the Gilt selloff to the appointment of Truss rather than the Gilt selloff being triggered by a short-term global bond sell-off. Unless, of course, one believes that the US Treasuries and European Bunds were also affected by Truss’s cutting of government spending. To market participants, at least, this was not the case, and the cause/effect connection was inappropriately ascribed.
Figure 5: 10-year benchmark yields in the US, UK, and Eurozone
Source: Bloomberg, 30 June 2025
Fund performance
The strategy of the fund is to provide investors access to a well-diversified credit portfolio that aims to outperform its targeted benchmark, iTraxx Crossover Total Return Index, on an after-fees basis over the longer run. We have no control over the performance of the benchmark and assume that all investors are aware of the risk/reward prognosis of that index.
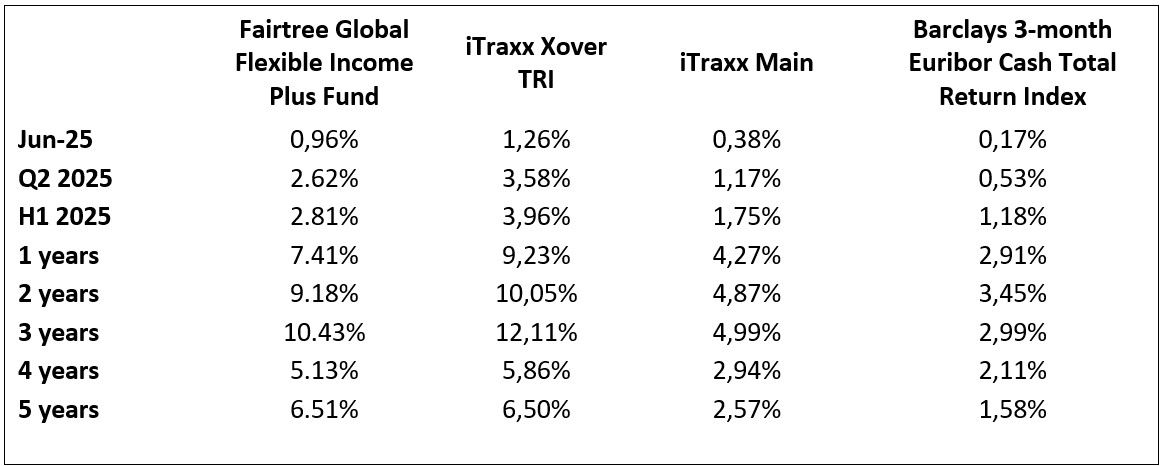
Table 3 shows the total performance of the Fairtree Global Flexible Income Plus Fund (Class A) relative to iTraxx XOver, iTraxx Main and the Barclays 3-month Euribor Index over various historic periods. It should be noted that the returns are net of full fees, and the full fees of Class A are 0.97% per annum. It is interesting to note that, although the short-term performance numbers are not that impressive relative to the benchmark, the longer-dated numbers still show marginal excess performance, even though the total fees are 0.97% per annum.
Table 3: Fairtree Global Flexible Income Plus Fund (Class A) historic annualised total returns to end Q2 2025
Source: Bloomberg, 30 June 2025
A few things become quite apparent, and even a touch startling, when analysing the table.
- The fund had a rather pleasing second quarter of 2025, generating 2.62% on an outright basis whilst outperforming cash by 2.09% on an after-all-fees basis.
- The fund has delivered in excess of 0.01% per annum above iTraxx XOver during the past five years and has delivered more than 4.9% excess return to cash over that period.
- The fund, despite its defensive positioning, has outperformed cash by around 4.50% on the most recent rolling one-year basis.
- The fund underperformed its benchmark by 0.96% during the second quarter due to running a low-risk bias.
Looking to the third quarter of 2025, the weakness that was witnessed in the previous quarter was seized upon and delivered excess performance during the second quarter. Credit spreads have narrowed again, however, delivering some healthy spread duration returns to the fund. This opportunity has closed, as the iTraxx 5-year Crossover spreads ended the quarter at 282 bps, or some 47 bps lower than where they ended the first quarter of the year. Currently, the fund spread sits at 365 bps, which is a little higher than where they were at the beginning of the quarter. After the two 25 bps rate cuts in April and June, EURIBOR has reduced to 1.94%, which indicates a total yield of around 5.60% on an NACQ basis. Subtracting the A Class TER of 0.97% from the yield gives us a pro-forma total return expectation of 1.15% for the third quarter. This obviously neglects capital gains or losses due to spread compression or expansion, as well as any movements in administered rates at the July and September meetings. We have pencilled in one more interest rate cut by the ECB relief at one of those meetings and feel that the risk case is for the ECB to have completed the cutting cycle. This outlook is dependent on the European inflation trajectory and its convergence to the official target of 2% as well as some more market-friendly international relations with the US.
In spite of this, we do believe that the global economic backdrop has improved somewhat, with global risk markets looking healthy at the time of writing. The quarter has got off to a good start with equities continuing the rally which started at the beginning of Q2.
Looking at the portfolio positioning, the fund has upped risk during the last quarter, and the fund is structured for a continuation of the credit bull run that started quite some time ago. We don’t see evidence of any impending risk-off sentiment, although we expect normal levels of volatility going forward. The fund remains fully defensively invested with ample liquidity to take advantage of any opportunities arising out of any market retracements that might present themselves during the next quarter.
The benchmark has rallied on a year-to-date basis, and although we feel that there is still further room for a continuation thereof, we do feel that at this stage of the cycle, a more defensive positioning is warranted. Our models do indicate that the fund is currently outyielding the benchmark on a pre-fees basis, but the excessive TER of the A-Class does make it quite hard for the managers to outperform the index on a post-fees basis. This probably needs some attention in the short run as the manager is quite loath to provide an investment vehicle that is not aligned to producing excess returns on an after-all-fees basis. The manager is not going to be sucked into excessive risk-taking to offset fee accretion at this point in the cycle.
Topics
Disclaimer
Fairtree Asset Management (Pty) Ltd is an authorised financial services provider (FSP 25917). Collective Investment Schemes in Securities (CIS) should be considered as medium-to-long-term investments.
Disclaimer
Fairtree Asset Management (Pty) Ltd is an authorised financial services provider (FSP 25917). Collective Investment Schemes in Securities (CIS) should be considered as medium-to-long-term investments.

Fairtree Balanced Prescient Fund Q2 2025 commentary
Tariffs, Geopolitics, Wait and See
The fund returned 6.73% over Q2-2025 and 9.95% year to date. The fund outperformed its peer group over the quarter and remained within the top decile year to date.
Over 3 and 5 years, the fund continues to be ranked within the top 10% of its peer group. The fund aims to provide investors with significant positive real returns and has outperformed inflation by 5% or more over the last 12 months, 3 years, 5 years and since inception.
We anticipate continued macroeconomic uncertainty throughout 2025. Global investors remain cautious amid evolving geopolitical tensions and shifting trade policies. In the US, ongoing tariff measures and mixed policy signals have weighed on sentiment, prompting a more defensive approach. In Europe, the mood is tentatively positive, underpinned by fiscal spending and supportive monetary policy. In emerging markets such as China, local policy support, easing potential, a weaker US dollar, lower oil prices and innovation in key sectors are helping to stabilise outlooks, although global risks continue to act as a drag.
South African sentiment is more cautiously optimistic. While the stronger rand and safe haven inflows point to resilience supported by commodity demand, a new inflation target, lower yields and improved terms of trade. However, political uncertainty is dampening confidence. The SARB’s decision to cut the repo rate (25bps) reflects economic support. Market sentiment remains cautiously optimistic, though structural and political headwinds persist. Risks to growth have tilted to the downside.
Our portfolio is diversified, highly liquid, and built to navigate a range of macro scenarios. We maintain a defensive allocation in developed markets and a more opportunistic view in emerging markets. We are overweight in government bonds globally and locally, while holding an underweight in equities, particularly in the US. We continue to favour domestic assets. The portfolio is structured to withstand slowing growth, geopolitical uncertainty, and persistent inflation pressures. We are neutral on cash, pending clearer signs of a broader global slowdown. While overall positioned defensively, we hold targeted positions that stand to benefit from improving conditions in China and South Africa.
In this environment, active management and adaptability remain essential. Our strategy is anchored in robust top-down macro insights, supported by disciplined bottom-up research.
Macro overview
The second quarter was marked by volatility, with markets shaken by renewed trade war concerns and direct conflict between Iran and Israel. Yet, despite the turbulence, financial markets held up well, risk assets generally moved higher, and several US Big Tech shares recovered from earlier lows. Emerging market equities and bonds also performed strongly.
The US economic data continued to slow in Q2 after GDP contracted by 0.5% in Q1 due to higher imports amid tariff concerns and weaker consumer spending. While employment remained resilient, consumer sentiment and household consumption softened. Inflation moderated, prompting several global rate cuts, while the Fed held steady as inflation remained sticky around 3% and the outlook uncertain. The Fed signalled a readiness for future rate cuts, highlighting downside risks to growth. Equity markets rallied strongly, hitting record highs by quarter-end, led by big tech and AI-related stocks, particularly the “Magnificent Seven,” which delivered double-digit returns. The Nasdaq outperformed, driven by names like Nvidia, while the S&P 500 and Dow also posted solid gains. Market performance was underpinned by strong Q1 earnings and renewed interest in growth stocks, as well as a shift to risk-on sentiment supported by easing inflation, improving trade talks, and expectations of policy support.
The US Treasury market saw a steepening yield curve in Q2, with long-term yields rising on fiscal concerns and short-term yields falling as softer data made the Fed more dovish. Fiscal concerns rose in May over rising debt, weak bond auctions, tax cuts, and after Moody’s downgraded the US credit rating. Yields fell again in June as some Fed members signalled support for rate cuts if inflation stayed low, though Chair Powell stuck to a cautious stance.
European sovereign bond yields fell in Q2, especially on shorter-dated bonds, driven by weaker growth expectations following US tariff threats and easing inflation. The ECB cut rates twice, bringing the main rate to 2.00%, while signalling the easing cycle may be nearing its end. Equities in the region gained, supported by the delay in US tariffs on EU imports, the ECB’s rate cuts, and a stronger euro. Germany showed signs of recovery, with the Ifo business climate index hitting a one-year high. Industrials and real estate led equity gains, while consumer discretionary, energy, and healthcare lagged.
Emerging market equities delivered strong returns in Q2. The performance was supported by improving trade sentiment, a weaker US dollar, lower oil prices and structural improvements in key regions. China rebounded from April lows as the US reached a trade truce with China. AI optimism and state support for the property sector also increased, though weak domestic data capped gains.
UK equities posted solid gains in Q2, with the FTSE 100 reaching a record high in June as markets stabilised following early-April tariff tensions and the UK struck a trade deal with the US. The Bank of England cut rates by 25bps to 4.25% in May, which, along with Governor Bailey’s call for closer EU ties, further boosted sentiment.
Commodities were the standout performers in Q2 2025. Gold briefly hit a record US$3,500/oz before ending the quarter up 6% at US$3,303, supported by geopolitical risk, central bank buying, and a weaker US dollar. The broader commodity complex performed well, and industrial metals like copper also gained before Trump announced a 50% tariff on copper imports. Oil fell 10% to US$67/barrel, with prices dragged down by oversupply concerns despite a temporary spike during the Middle East conflict.
South African equities ended Q2 in positive territory, led by a strong rebound in the resources sector, particularly platinum group metals and gold miners. Improved political stability and investor confidence supported a 1.62% appreciation in the rand to R17.71/USD. Bond yields declined across the curve, supported by a 25bps rate cut from the SARB and comments suggesting a new 3% inflation target could be announced soon. This shift in tone, alongside a more favourable inflation outlook, helped anchor expectations. Inflation remained subdued, with headline CPI at 2.8% and core inflation at 3.0%. While economic growth remains weak, with Q1 GDP rising just 0.1% q/q and 0.8% y/y, slow structural reforms and improved macro stability are bolstering medium-term prospects.
Government of National Unity (GNU) dominating headlines in Q2. After early disagreements over the National Budget, the GNU managed to pass a revised fiscal framework, seen as a positive signal by markets. Sentiment was further supported by President Ramaphosa’s trip to the US alongside DA leader John Steenhuisen, where they presented a united front in talks with President Trump. However, cracks in the coalition reappeared in June when Ramaphosa dismissed a senior DA cabinet member, prompting the DA to boycott the upcoming National Dialogue.
Market review
Global equity markets rebounded from Q1. Global equities rose 7.7%%, while ex-US equities outperformed with 12%. US equities rose 11% mostly led by the strong performance of the large consumer technology stocks. The equally weighted S&P500 was up 3.4% over the quarter, showing how concentrated the US equity rally is. Europe was up 2.5% and Emerging Markets up 12%. Within Emerging Markets, China 2% and South Africa outperformed 13.6%.
SA Equities (Capped SWIX) was up 9.7% over the quarter. SA industrials was the best performing sector, up 12% (with Naspers/Prosus and MTN performing the best within the index), and SA resources was up 9.8% predominantly driven by gold stocks (Anglogold Ashanti and Anglo America performing well) and PGM stocks (Valterra and BHP performing well). The rand appreciated around 3.5% over the quarter against the US dollar.
During the quarter, the South Africa All Bond index rose 5.9% and cash returned 1.9%. The Bloomberg Barclays Global Aggregate Bond Index gained 0.9% over the quarter.
Commodities were strong in general, with Palladium (11.7%), Gold (5.8%) and Platinum (36.2%) the strongest performers.
The US dollar weakened by 7% against the major currencies as policy uncertainty increased and the growth outlook weakened.
Portfolio performance
The Fund returned -0.3% over Q4 2024 and 13.4% over 2024. The Fund underperformed its peer group over the quarter but outperformed over the year.
The fund returned 6.73% over Q2-2025 and 9.95% year to date. The fund outperformed its peer group over the quarter and remained within the top decile year to date. This outperformance was primarily driven by the positive contribution from asset allocation, offsetting the negative contribution from security selection. Our security selection within SA Equity, Global and Emerging Market Equity detracted from excess returns, while security selection within Commodities and SA Property contributed to excess returns.
Our SA Equity exposure underperformed the FTSE/JSE Capped Shareholder Weighted (Capped SWIX) Index. Our overweight exposure to Gold Miners was the key performance contributor during the quarter, along with our overweight position in Prosus & Naspers. This was more than offset by negative contributions from our overweight positions in General Retail & Diversified Miners and underweight exposure towards PGM Miners and Global Defensive stocks like Richemont & British American Tobacco.
Within Global Equity, overweight exposure to Technology contributed, while overweight exposures to Consumer Discretionary and Financials detracted.
Within Commodities, our overweight in Gold and Platinum contributed to excess returns.
Within asset allocation, our decisions to be overweight SA Equity and Emerging Market Equity and underweight Global Equity worked in our favour. Our overweight in Commodities also contributed, while being overweight in US Treasuries detracted.
Portfolio positioning
Within this environment of unpredictable policy setting, we remain focused on portfolio diversification, flexibility, and liquidity. Not only is the portfolio diversified across asset classes, sectors, and stocks, but also various potential economic outcomes. As the probability of tail events rises, the ability and willingness to move the portfolio quickly increase.
Our portfolio has both defensive and opportunistic characteristics. We are defensively positioned for a slowdown in the US, where valuations are higher and the central bank is constrained by sticky inflation, while opportunistically positioned to take advantage of a recovery in emerging markets, including China and South Africa, where valuations are more attractive and central banks have more scope to ease policy. The overall macro environment, however, may continue to swing between a state of decent growth & sticky inflation and a state of labour market concerns & continued disinflation.
We therefore remain overweight SA Equities and Emerging Market Equities and underweight Global Equities. We have trimmed our underweight to SA Property and remained overweight SA Bonds as the outlook for lower funding cost improved, along with better fiscal dynamics and increased foreign participation. We remain underweight in Global Property. We remain overweight in Global Fixed Income, which will benefit from a US economic slowdown. We are overweight Commodities, particularly gold and platinum, as they continue to benefit from rising geopolitical tension.
We remain overweight SA Equities and underweight Global Equities, in particular US equities, where valuations are elevated, rates are high, and signs of a slowing consumer are emerging. We are more constructive on Emerging Markets and, particularly, China, where policymakers have accelerated policy easing in response to weak economic data and Fed easing. Valuations here remain attractive as a lot of bad news has already been priced into assets. Over 2024, we have increased our exposure to SA economy-facing sectors and continue to hold these.
We have a tactical underweight in SA Property after strong performance last year. While property fundamentals have improved, especially for retail and industrial, the overall outlook remains uncertain in the short term. We remain underweight Global Property.
We remain overweight in both SA and Global Fixed Income, which will benefit from a US economic slowdown. Local bond yields have fallen significantly but remain attractive on a relative and absolute basis given the outlook for lower inflation, rate cuts, fiscal consolidation and increased foreign flows into the asset class.
We are overweight Commodities, particularly gold and platinum. Gold has done well on geopolitical tensions and central bank diversification.
Notes: MSCI country indices used where no index is shown. Internal index currently consists of 45% FTSE/JSE Capped Swix, 25% MSCI AC World, 2% FTSE SA Listed Property Index, 2.5% FTSE EPRA NAREIT Developed Index, 1.5% Equal Weighted SA Commodity ETFs, 18% All Bond Index & 4% STEFI & 2% US Overnight Cash.
Topics
Values-driven investing
Download our Factsheet
Download the monthly factsheet to view comprehensive information and performance data.

We are Fairtree
Subscribe to our newsletter
Stay informed with the latest insights and updates. Subscribe to our newsletter for expert analysis, market trends, and investment strategies delivered straight to your inbox.
"*" indicates required fields
FAIRTREE INSIGHTS
Your may also be interested in
Explore more commentaries from our thought leaders, offering in-depth analysis, market trends and expert analysis.


Fairtree Global Flexible Income Plus Fund Q2 2025 Commentary
After the very slow start for US equities during the first quarter, and the superior performance emanating from the EU and the UK, the second quarter witnessed a turnaround in fortunes with the tech-heavy NASDAQ delivering its fourth-best quarterly performance number over the past 18 years.


Fairtree Global Equity Fund Q2 2025 Commentary
US equities ended the quarter 11.2% higher; however, they experienced pronounced volatility following President Donald Trump’s ‘Liberation Day’ announcements of tariffs on imported goods.

Fairtree BCI Income Plus Fund Q1 2025 Commentary
It was a complete turnaround in the fortunes of global equities in the first quarter of 2025. The 47th US President was sworn in during the period, and contrary to popular opinions, the US stock market took a bit of a beating from a relative perspective.
Disclaimer
Fairtree Asset Management (Pty) Ltd is an authorised financial services provider (FSP 25917). Collective Investment Schemes in Securities (CIS) should be considered as medium to long-term investments. The value may go up as well as down, and past performance is not necessarily a guide to future performance.

Fairtree Global Equity Fund Q2 2025 Commentary
The fund returned 10.9% for the quarter, underperforming the benchmark by 0.6%. The MSCI ACWI Index ended 11.5% higher, with the biggest gainers being the Netherlands and Germany, increasing 18.3% and 16.3% respectively. The MSCI Emerging Markets Index increased by 12% driven by impressive gains in South Korea and Taiwan, increasing 32.8% and 26.1% respectively (all in USD).
US equities ended the quarter 11.2% higher; however, they experienced pronounced volatility following President Donald Trump’s ‘Liberation Day’ announcements of tariffs on imported goods. The new tariffs were later suspended for 90 days across most countries, resulting in the subsequent rebound of shares, with the S&P500 registering an all-time high by quarter-end. The US economy contracted at an annualised rate of 0.5% in the first quarter, primarily due to a surge in imports ahead of anticipated tariffs and a decrease in government spending. The labour market remained strong, while CPI inflation continued to slow over the period. Despite these mixed signals, the Fed maintained its benchmark interest rate at 4.25% – 4.5%, citing increased economic uncertainty and the potential risks posed by new tariffs. European equities rallied 11.4% over the quarter, with robust performances from the Netherlands and Germany, increasing 18.3% and 16.3% respectively. Germany’s equity rally was driven by fiscal stimulus plans, easing US trade tensions and renewed investor interest in undervalued European stocks. The region saw strong corporate earnings, declining inflation pressures and a further 50 basis points cut to rates by the ECB to 2%. Within Emerging Markets, South Korea surged 32.8%, driven by post-election optimism, the government led “Value Up” reforms to boost corporate valuations and a rally in financials, industrials and large-cap exporters and chipmakers like Samsung, SK Hynix, Hyundai and Kia. Taiwan’s market gained 26.1%, driven by booming AI-related semiconductor demand, easing US-China trade tensions, and strong foreign capital inflows.
On a sector level, Health Care and Energy were the worst-performing sectors over the quarter. The energy sector was dragged lower by the oil price declining 9.5% over the period, where the fund’s underweight holding added to relative performance. The overweight holding in health care and the underweight in industrials, however, detracted from relative performance. The Trump administration is seeking to lower drug prices in the US, which has pressured the healthcare sector. The Information Technology sector was the best-performing sector over the period, where the fund’s overweight positioning contributed to relative performance. Stock picking within the consumer discretionary and financials sectors detracted from relative performance, while stock picking within the materials and the consumer staples sectors added to relative performance.
Noteworthy portfolio actions over the quarter included partially switching the funds’ EM technology exposure in Pinduoduo and Prosus into a larger position in JD.com, as well as topping up the existing positions in the DM technology businesses of Google and Applied Materials. The fund holdings in Ross Stores, Sysco, UnitedHealth Group and Vertiv Holdings were sold during the quarter. New positions were initiated in Progressive Corp, Lowe’s, Goldfields and Fiserv, while the positions in BP and Glencore were topped up on weakness.
Notable contributors to fund performance were positions in Microsoft (+153bps absolute, +39bps relative), Nvidia (+93bps absolute, -64bps relative) and Broadcom (+63bps absolute and relative). Notable detractors from performance over the quarter came from JD.com (-68bps absolute and relative), Pinduoduo (-58bps absolute and relative) and Kaspi (-45bps absolute and relative).
The fund is positioned with an underweight in the cyclical and defensive names, in favour of EM technology exposure and a neutral DM technology holding. From a geographical perspective, the fund remains underweight in the US and Canada, while being overweight in China through technology shares and Kazakhstan through financial shares.
Topics
Disclaimer
Fairtree Asset Management (Pty) Ltd is an authorised financial services provider (FSP 25917). Collective Investment Schemes in Securities (CIS) should be considered as medium to long-term investments. The value may go up as well as down and past performance is not necessarily a guide to future performance.
Fairtree Market Insights: Travel Edition Episode 6
Topics

Transcript
FAIRTREE INSIGHTS
Your may also be interested in
Explore more commentaries from our thought leaders, offering in-depth analysis, market trends and expert analysis.
Fairtree Market Insights with Karena Naidu | Episode 7: Part 2
Market Insights, an exciting video series where Karena Naidu, Global Investment Specialist, delves into key insights in global equity markets with Equity Portfolio Managers Cornelius Zeeman and Jacques Haasbroek.
Fairtree Market Insights with Karena Naidu | Episode 7: Part 1
Market Insights, an exciting video series where Karena Naidu, Global Investment Specialist, delves into key insights in global equity markets with Equity Portfolio Managers Cornelius Zeeman and Jacques Haasbroek.
Macro Pulse Episode 19
In this episode, Jacobus shares his outlook for the remainder of 2025. He unpacks the current policy environment and its implications for various asset classes, and wraps up with a look at the latest developments in the local economy.
Fairtree Market Insights: Travel Edition Episode 5
Topics

Transcript
FAIRTREE INSIGHTS
Your may also be interested in
Explore more commentaries from our thought leaders, offering in-depth analysis, market trends and expert analysis.
Fairtree Market Insights with Karena Naidu | Episode 7: Part 2
Market Insights, an exciting video series where Karena Naidu, Global Investment Specialist, delves into key insights in global equity markets with Equity Portfolio Managers Cornelius Zeeman and Jacques Haasbroek.
Fairtree Market Insights with Karena Naidu | Episode 7: Part 1
Market Insights, an exciting video series where Karena Naidu, Global Investment Specialist, delves into key insights in global equity markets with Equity Portfolio Managers Cornelius Zeeman and Jacques Haasbroek.
Macro Pulse Episode 19
In this episode, Jacobus shares his outlook for the remainder of 2025. He unpacks the current policy environment and its implications for various asset classes, and wraps up with a look at the latest developments in the local economy.