Fairtree BCI Income Plus Fund Q4 2024 Commentary


Market dynamics
The fourth quarter witnessed a turnaround in the relative performance of large-cap to mid-cap indices. The Dow Jones Industrial Average posted a sub-par 0.93% over the period, underperforming the resurgent, tech-heavy NASDAQ, which recovered from its underperformance in the previous quarter. The NASDAQ produced a rather pleasing 6.36% in USD, which ranks as the 31st best quarter since Q2 2007 or a dataset consisting of 71 quarters. As has become the norm for some time, North American equities outperformed their European and British counterparts, which is not that surprising, given the more socialist-leaning policies that have been adopted in both Europe and the UK. Unfortunately for the UK, which has recently elected a less market-friendly government, the FTSE showed a negative quarter, destroying some 0.18%, and that looks to be about as good as it is going to get over the next few years. One must assume that this is fully discounted, considering that the Chancellor of the Exchequer spent more time changing artworks in No. 11 rather than focussing on realistic and achievable fiscal policy. The solution to labour problems cannot be to nationalise and pay higher salaries, but market fear is that this is merely a taste of what the future has in store for the ever-diminishing British taxpayer. In their defence, they did inherit an already wobbly system, which had slowly degraded over the past decade, but the market will be watching the policy choices of the new decision-makers with keen attention.
Moving to European credit, the iTraxx suite of indices produced more numbers in the black, with the bellwether 5-year Crossover index (75 equally weighted global sub-investment grade names) producing a rather healthy 1.59%, comfortably outperforming cash. Our more favoured two-time levered index produced an even better number at a 2.36% gain, comfortably outperforming the majority of equity indices. It is most interesting to note that European Credit outperformed European equity indices, with the exception of the German Dax index, which produced 3.02% or the 37th-best rank over the 71 quarterly historical datasets.
Table 1: Major Index Q4 2024 Total Return and historical rankings Q2 2007 – Q4 2024
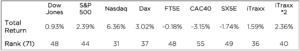
Source: Bloomberg 31 December 2024
Given the fact that we have 17.75 years of quarterly data, we can do more than just look at the performance numbers as well as the relative rankings. We can also look at relative risk measures, such as standard deviations, Sharpe Ratios (SR) and other measures of risk-adjusted returns. This should be important to investors who do “feel” risk in the diffusion of the performance that they have delivered. For the same absolute return in a portfolio, only a fool would be happy with more risk for that return than less risk. There are many definitions of what risk is, and what is important for one investor is quite different from another, but we feel that the most consistent and comparable is the time-tested standard deviation, which has its roots in its mathematical construct. This makes it totally consistent in its treatment of any distribution of potential outcomes. The simple calculation of mean divided by standard deviation gives a good measure of risk-adjusted return and is one that we tend to like to look at. This is not the SR, as the SR strips out risk-free return as well as the volatility of that risk-free return, but we feel that the basic return per unit risk ratio is a good proxy for the slightly more rigorous SR. Obviously, a higher number is better as the investor receives more return for his accumulated risk. We must be aware, however, that a high number on its own cannot be viewed as the “Holy Grail”, since any low volatility index might deliver high levels of Return Co-efficient but might not deliver that much by way of return. For example, it might be foolish to buy an index that produces a 0.4% annual return with 0.2% annualised volatility – a return coefficient of 2, rather than an index that produces a 12% return with a standard deviation of 8%.
Table 2 shows the annualised returns, the annualised risk as well as the return co-efficients for the major indices that we monitor. These numbers are generated from our historical dataset and, therefore, do include risk periods such as the Global Financial Crisis (GFC), the Greek Government default crisis, the COVID-19 global pandemic, the more recent Ukraine/Russian war as well as the current war in the Middle East, and all the political turmoil in Europe, the UK and the US. Perhaps it is more of the same rather than the exception at the moment, with the world, as usual, teetering on the brink of the potential for some financial fallout, but the traditionalist would suggest that this potential for fallout is the very reason that risk premia exist in the first place. No risk should have risk-free returns; those who choose to take the risk of loss should surely be rewarded for doing so. This line of argument would go a long way in explaining persistence in market returns; the “overvaluation” of US equities has been bandied around for the last two decades, and yet they continue to outperform their European counterparts. Contrary to popular opinion, the outperformance will more than likely continue until participants accept it as the “new normal”. And when that eventually happens, it will probably be followed by a reversal of fortunes.
From a European perspective, Table 2 highlights the outperformance of credit from a risk-adjusted perspective. In fact, the more risk normalised two times levered index solidly outperformed its equity equivalent, offering investors excess return for a given risk target. If an investor is comfortable with equity-type risk, they should be more than happy with the extra return that iTraxx*2 has offered. This index goes a long way to close the relative gap to US equities and provides a rather good fund diversifier to the allocator that has a US strategic overweight.
Table 2: Index Risk-Adjusted Return Co-efficient
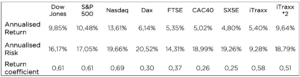
Source: Bloomberg 31 December 2024.
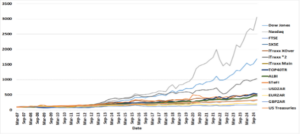
As an extension of last quarter’s report, Figure 1 below shows the cumulative return of the various indices in the currency of the particular index domicile. The various performance traces were indexed to 100 at the beginning of the second quarter of 2007 when we had the complete historical data for the iTraxx XOver and Main total returns.
When looking at Figure 1, it also becomes apparent that there are no returns to risk-free. The worst performing traces over the 17.75 years are the iTraxx Main Index (125 equally weighted global investment grade credit names) and the US Treasuries Total Return Index. Looking at the delivered risk, it becomes apparent that US Treasuries are not the least risk asset class but rather the well-diversified investment grade CDS index – iTraxx Main. Lowest returns but the lowest associated risk over the past 17.75 years.
Figure 1: Major Index Total Return Q2 2007 – Q4 2024
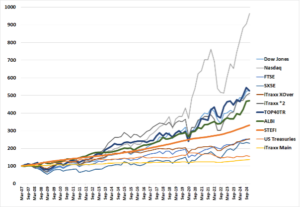
Source: Bloomberg 31 December 2024
It is difficult to look at the returns and the associated volatility of those returns simultaneously in Figure 1. To disentangle the graphic and the more meaningful comparatives, we produce the delivered risk (as computed by the annualised standard deviation of quarterly returns) as well as the delivered annualised return over 17.75 years. This is shown in Figure 2. If we were to fit a straight line to this dataset, we would observe an upward slope indicating that there is a positive return to risk. Increase that risk, and it should result in a higher delivered return. The corollary of this is also apparent; a reduction in risk will result in a reduced overall delivered return. The textbooks, which have always stated that there needs to be an excess return to risk, are indeed correct.
I have chosen the y-axis scale on purpose to show the effects of the FX translation on the hard currency returns of the non-SA indices. This will become apparent when the comparatives are drawn in a later figure.
Figure 2: Major Index Risk Return scatterplot Q2 2007 – Q4 2024
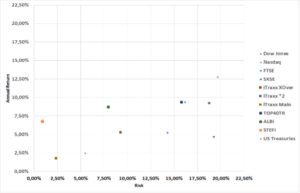
Source: Bloomberg 31 December 2024.
The domination in return terms of US equities, which was touched on earlier in this piece, is quite apparent in the figure, but one must be cognisant of the fact that these indices are shown in local currency. This explains the relatively good performance of the South African Top40 Total Return Index, which is based on the rand. To do a proper comparative study, we need to translate all the indices into common currency, and there, the comparative becomes more meaningful.
Figure 3 shows the index returns in ZAR, which again shows the domination of US equities over their European counterparts. The long-term outperformance of US risk assets translated into ZAR validates questions regarding asset allocators’ offshore exposures.
Source: Bloomberg 31 December 2024.
Moving to the economic backdrop, Figure 4 shows inflation in the developed world (the US, the UK, Eurozone and South Africa), highlighting the fact that inflation is well off its highs hit in the fourth quarter of 2022. The disinflationary trend, which started in the US, seems to have slowed down and has resulted in a more cautious response from the central banks. What is interesting to note is the convergence of South African headline inflation to the developed nations; this might indicate that there is some extra room for the SARB to consider more aggressive cuts, certainly from a relative perspective. The SARB has been cautious to date, it is perhaps time to bank the benefits of this approach by loosening monetary policy. The Governor himself stated an equilibrium real repo of 2.8%, which in turn suggests a repo range of 5.8-8.8% with a mid-point of 7.3%. This certainly still means that with SA CPI at 2.9%, we are still in very restrictive territory.
The Fed did start its long-awaited cutting cycle, lowering its target rate by 50 bps at the September meeting and following it up with two more 25 bps cuts at the November and December meetings. We consider the Fed response to be about correct and contend that the extent of this cutting cycle, given the newer data, should be between 150-200 bps, which has trimmed about 50 bps from our previous forecast. As is always the case, the Fed response will be data dependent, and with inflation remaining stubbornly high as well as the jobs market suggesting that labour conditions could be construed as being “tight”, we think that the cutting cycle will be curtailed somewhat, but we are certainly not in the camp that is suggesting that the cutting cycle has now been completed.
Figure 4: Annual change in Consumer Price Indices
Source: Bloomberg 31 December 2024.
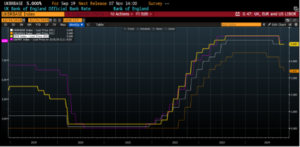
Figure 5 below shows the level of short rates as administered by the US Federal Reserve, the European Central Bank (ECB), the Bank of England and the South African Reserve Bank. What is of interest to note is the high levels of correlation in both the direction as well as the extent of policy. The other point to highlight is that the response from the SARB has been the most restrained in terms of timing and extent. The Fed has cut by 100 bps, the ECB 135 bps, the BOE 50 bps and the SARB, only 50 bps, albeit off a much higher base. We contend that the SARB certainly does have further “wood to chop” and believe this should be done sooner rather than later, as the window of opportunity seems to be closing rather smartly.
Figure 5: Central Bank Administered Rates
Source: Bloomberg 31 December 2024
The movements in global bond yields are shown in Figure 6. The 10-year US Treasury, the UK Gilt, the benchmark European Bund and the 10-year South African Government 10-year Bond are shown in the Figure, albeit using three different scales. It is interesting to point out the high levels of correlation between these four traces and that although short-term disconnects tend to take place, they generally are swiftly reversed. Bearing this in mind, one can see that the current yield on the generic 10-year SA bond is probably unsustainable. It does not take much by way of imagination to see that the bond is currently trading at too low a yield from a relative perspective, and local bulls should be aware that the more short-term outperformance of the local asset class is not based on global fundamentals, and that those relative valuations will be the determining factor of where yields find their equilibrium level. Of course, it does take all types to make a market, and the current price is real. We should, therefore, be cautious of having too strong a view on such matters as “betting the farm” on one’s views on current valuations is never a great strategy, but small tactical overweight/underweights must be based on something.
Figure 6: 10 year benchmark yields in US,UK and SA
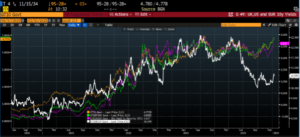
Source: Bloomberg 31 December 2024
Fund Performance
The strategy of the Fund is to provide investors access to a well-diversified credit portfolio that aims to outperform its targeted return of STeFI+3% over the long term. Table 3 shows the total performance of the Fairtree BCI Income Plus Fund relative to STeFI, the All Bond Index (ALBI) as well as the Top40 Total Return Index. One should take note that the indices carry no fees whilst the Fund performance is in accordance with Class A, which has a TER of 0.91% per annum, as currently reported by Bloomberg.
Table 3: Fairtree BCI Income Plus Fund historic annualised total returns to end Q4 2024
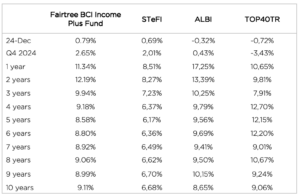
Source: Bloomberg 31 December 2024
A few things become quite apparent, and even a touch startling, when analysing the table.
- The Fund had another great quarter, generating 2.65% on an outright basis whilst outperforming STeFI by 0.64% on an after-all fees basis. This beat our expectations of 2.50% for the quarter.
- Over the past four years, the Fund has delivered in excess of 3% per annum above STeFI and more than 2.6% excess return per annum over all measurement periods.
- Despite its defensive positioning, the Fund has outperformed STeFI by around 2.83% on a calendar year basis.
- The Fund exceeded its target for calendar 2024 and is currently defensively positioned.
Looking forward to the first quarter of 2025, the fund spread is currently at 235 bps so with 3m JIBAR at 7.75% we have a current yield on the fund of around 10.15% on a pre-fees basis. This should deliver around 2.3% post-fees for the upcoming quarter or around 0.80% per month.
Looking a bit further out, one-year swaps closed the quarter unchanged from the previous quarter at 7.44%, so prospectively, the Fund should deliver just under 9.8% on a pre-fees basis. Our central case is that over the next 12 months, the Fund should deliver between 9.25% – 9.50% post fees, but those numbers are based on the market’s current discounting of a further 50 bps of rate cuts. Given the bearishness of our MPC, based on global sentiment, the market seems to be taking a few cuts off the table, with the expectation for merely 25 bps of cuts with low probabilities of another 25 bps sometime in the future. Our base case is for 75 bps from here, with a terminal repo of 7% and an associated JIBAR of 7.10%. Given the Governor’s stance on a real repo of 2.8%, I do not think this is an outlandish call. This would imply that the CPI is around 4.2% or way above the current CPI level of 2.9%.
As is always the case, we continue to explore both local and global credit spread opportunities in a measured manner. The scoreboard certainly highlights that we have continually delivered in accordance with our mandate, preserving capital while offering investors a healthy risk premium against STeFI. We look forward to the continuation of the delivery of high levels of outperformance at low levels of associated volatility.
Topics
Values-driven investing
Download our Factsheet
Download the quarterly report to view comprehensive information and performance data.


We are Fairtree
Subscribe to our newsletter
Stay informed with the latest insights and updates. Subscribe to our newsletter for expert analysis, market trends, and investment strategies delivered straight to your inbox.

"*" indicates required fields

FAIRTREE INSIGHTS
You may also be interested in
Explore more commentaries from our thought leaders, offering in-depth analysis, market trends and expert analysis.

Fairtree Global Flexible Income Plus Fund Q2 2025 Commentary
After the very slow start for US equities during the first quarter, and the superior performance emanating from the EU and the UK, the second quarter witnessed a turnaround in fortunes with the tech-heavy NASDAQ delivering its fourth-best quarterly performance number over the past 18 years.

Fairtree Balanced Prescient Fund Q2 2025 commentary
We anticipate continued macroeconomic uncertainty throughout 2025. Global investors remain cautious amid evolving geopolitical tensions and shifting trade policies.


Fairtree Global Equity Fund Q2 2025 Commentary
US equities ended the quarter 11.2% higher; however, they experienced pronounced volatility following President Donald Trump’s ‘Liberation Day’ announcements of tariffs on imported goods.
Disclaimer
The highest calendar year return was 13.06%, and the lowest calendar year return was 5.58% (information as of 31 December 2024). The fund has returned an annualised return of 9.04% since inception (12 March 2014) (Benchmark return: 8.23% since inception). Fund returns disclosed are annualised returns net of investment management fees and performance fees. Annualised return is the weighted average compound growth rate over the period measured. The information in this two-pager is provided as a general summary only.
Past performance is not necessarily a guide for future performance. Fund investment risk indicator level: conservative. Actual investment returns are available on request. The investment Performance is for illustrative purposes only. The investment performance is calculated by taking the actual initial fees and all ongoing fees into account for the amount shown; and income is reinvested on the reinvestment date.
Boutique Collective Investments (RF) (Pty) Ltd (“BCI”) is a registered Manager of the Boutique Collective Investments Scheme, approved in terms of the Collective Investments Schemes Control Act, no 45 of 2002 and is a full member of the Association for Savings and Investment SA.
Collective Investment Schemes in securities are generally medium- to long-term investments. The value of participatory interests may go up or down, and past performance is not necessarily an indication of future performance. The Manager does not guarantee the capital or the return of a portfolio. Collective Investments are traded at ruling prices and can engage in borrowing and scrip lending. A schedule of fees, charges and maximum commissions are available on request. BCI reserves the right to close the portfolio to new investors and reopen certain portfolios from time to time in order to manage them more efficiently. Additional information, including application forms, and annual or quarterly reports can be obtained from BCI, free of charge.
Performance figures quoted for the portfolio are from Morningstar, as at the date of this document for a lump sum investment, using NAV-NAV with income reinvested and do not take any upfront manager’s charge into account. Income distributions are declared on the ex-dividend date. Actual investment performance will differ based on the initial fee charge applicable, the actual investment date, the date of reinvestment and dividend withholding tax.
Investments in foreign securities may include additional risks, such as potential constraints on liquidity and repatriation of funds, macroeconomic risk, political risk, foreign exchange risk, tax risk, settlement risk as well as potential limitations on the availability of market information.
Boutique Collective Investments (RF) Pty Ltd retains full legal responsibility for the third-party named portfolio.
Although reasonable steps have been taken to ensure the validity and accuracy of the information in this document, BCI does not accept any responsibility for any claim, damages, loss or expense, however, it arises, out of or in connection with the information in this document, whether by a client, investor or intermediary. This document should not be seen as an offer to purchase any specific product and is not to be construed as advice or guidance in any form whatsoever. Investors are encouraged to obtain independent professional investment and taxation advice before investing with or in any of BCI/ Manager’s products.
Access the BCI Privacy Policy and the BCI Terms and Conditions on the BCI website (www.bcis.co.za). A portfolio that derives its income primarily from interest-bearing instruments in accordance with Section 100(2) of the Act, whether the yield is historic or current, as well as the date of calculation of the yield.
About you…
By proceeding, I confirm that:
- To the best of my knowledge, and after making all necessary inquiries, I am permitted under the laws of my country of residence to access this site and the information it contains; and
- I have read, understood, and agree to be bound by the Terms and Conditions of Use described below.
- Please beware of fraudulent Whatsapp groups pretending to be affiliated with Fairtree or Fairtree staff members.
If you do not meet these requirements, or are unsure whether you do, please click “Decline” and do not continue.