Wild Fig Multi Strategy Hedge Fund Quarterly Investor Update


Introduction
Q1 2025 reminded us that the well-known saying “the only constant is change” remains as relevant today as ever before. In a quarter dominated by trade tariffs; new entrants in the artificial intelligence (AI) race; US policy uncertainty; a falling US 10-year Treasury yield and a weaker dollar, non-US indices bucked the trend of US domination with Chinese (Hang Seng +19.4%), European (EuroStoxx 600 +9.9%), UK (FTSE 100 +8.2%) and South African (JSE All Share +8.5%) indices delivering strong returns (all in USD).
US domination came under pressure in Q1 2025, with the S&P500 and NASDAQ 100 declining -4.6% and -10.4% respectively (in USD). Information technology and consumer discretionary sectors lead the indices lower. News out of China that DeepSeek had developed an artificial intelligence (AI) model comparable to market leaders (but at a fraction of the cost) caused investors to reassess expectations around AI and US domination in the field. The “Magnificent Seven” which has enjoyed the AI themed tailwind in recent years were subsequently put under pressure by this news. Trade tariffs, another key theme of Q1 and almost certainly for quarters (if not years) to come, created further uncertainty in markets. President Trump announced tariffs on certain countries, notably Mexico and Canada. As the quarter came to a close, investors were awaiting Trump’s comments on 2 April, dubbed “Liberation Day”, for further clarity on the way forward on the global tariff landscape. The Federal Reserve kept interest rates on hold at 4.25-4.50% during the quarter.
Chinese equities rose sharply during the quarter on the back of domestic government support measures (interest rate cuts; support for the troubled property sector and liquidity injections) which helped to improve investor sentiment. Advances in artificial intelligence (Ai) by Chinese companies (e.g. DeepSeek) have also led investors to reevaluate China as a leader in the technology sector with strong growth potential.
Domestically, the South African Reserve Bank held the repo rate at 7.50% in March, maintaining a cautious stance after cutting rates in January. Tensions in the GNU, sparked by a dispute regarding a VAT hike, led to the postponement of the national budget speech. Despite the growing tensions with the US, the South African rand strengthened by c.3% against the Dollar during the quarter. Despite the macro and social economic challenges, the country faces, South African equities delivered strong returns (JSE All Share +5.9% in ZAR) which was spurred on by a surge in precious metal prices.
In summary, the Fairtree Wild Fig Multi Strategy FR QIHF, “Wild Fig”, our flagship multi-strategy balanced hedge fund had a relatively lacklustre quarter, delivering (-2.5%) in Q1 2025. On a rolling 12-month view, the Fund has delivered a strong double-digit return (19.3%) after fees. The Fund remains true to its investment objective of compounding clients’ capital over the long term. We thank you for entrusting us as stewards of your capital.
Wild Fig Multi Strategy
Portfolio Management Team
Quarterly Performance: Wild Fig FR Multi Strategy QIHF
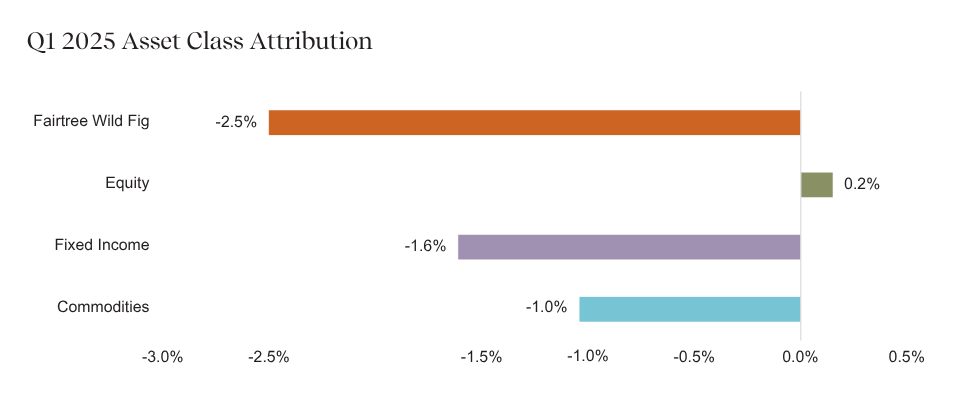
Source: Fairtree, Bloomberg.
A lacklustre first quarter of 2025 was attributable to positioning in Fixed Income (more specifically our SA Fundamental strategy) and Commodities, whilst positioning in Equities marginally offset the drawdown.
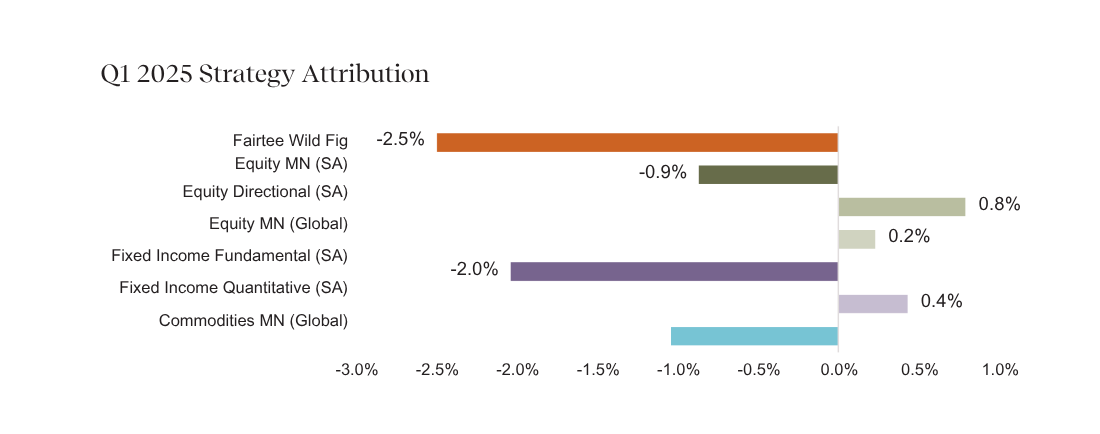
Source: Fairtree, Bloomberg.
Although the SARB has been reluctant to cut rates on the back of global policy uncertainty (trade war) and the impact that potential tariffs could have on inflation, the Fixed Income Fundamental (SA) strategy continues to hold the view that there aren’t enough rate cuts currently being priced in the market. The view is supported by current and forecasted inflation being in the lower end of the SARB’s target range; real rates remaining high; disappointing local economic growth and the rand remaining relatively resilient.
Within the Commodities strategy, some pairs have moved into multi-decade extreme levels of dislocation. Despite a negative return for the quarter, the team has conviction that their positioning will play out positively over time. As a reminder, the agricultural and soft commodity strategy remains one of the lowest heartbeat strategies (from a,volatility standpoint) within the Wild Fig construct.
The “Holy Grail” of Uncorrelated Returns
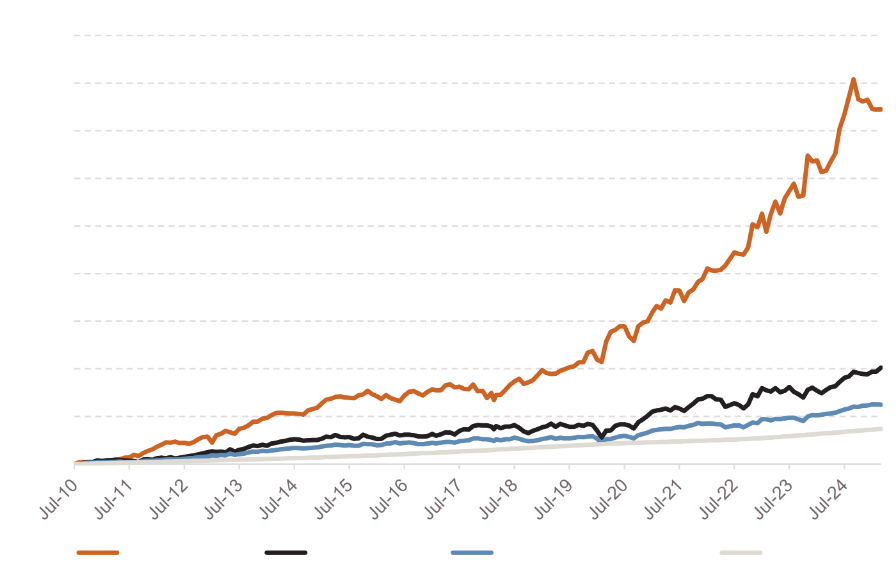
In the years following the GFC, highly accommodative global monetary policies resulted in increased availability of money supply and low-interest rates, increasing global liquidity and driving equity markets higher. As a result, hedge funds lost popularity as high beta and growth outperformed most alternatives.
Figure 1: Rising equity indexes driven in part by rising liquidity
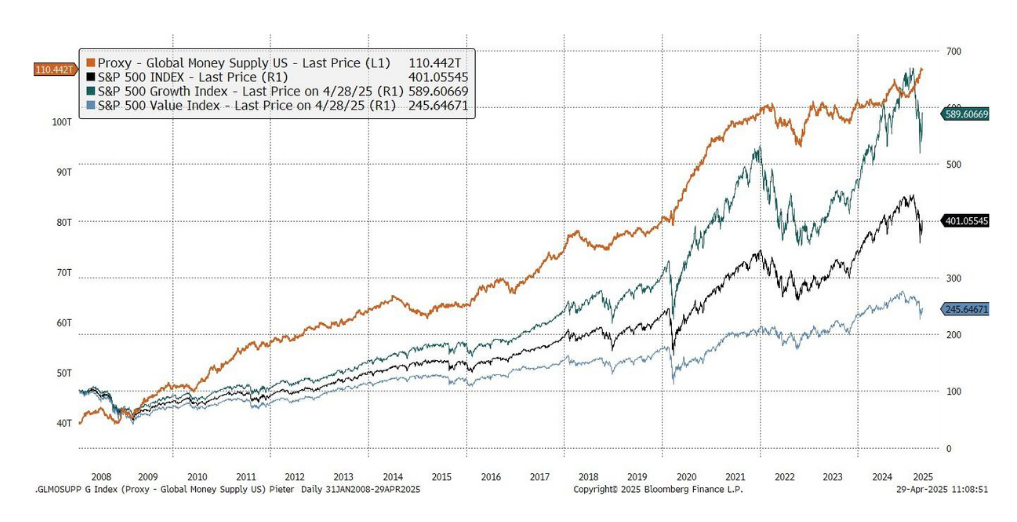
This market backdrop led investors to question the need for hedge fund exposure altogether, often culminating in the future viability of the asset class being questioned. This however changed dramatically with the advent of the so-called, and well reported, “Sea Change “, popularised by Howard Marks in 2022 during a time when speculative and growth expectations subsided. Stocks fell sharply on the back of rising inflation and subsequent restrictive monetary policy. However, as the traditional safe-haven correlation between stocks and bonds broke down, a rare dynamic occurring when a slowdown in growth is accompanied by rising inflation and not a recession, many hedge funds outperformed traditional “60/40” balanced portfolios.
Figure 2: Traditional “Balanced” 60/40 portfolio and sub-allocation returns
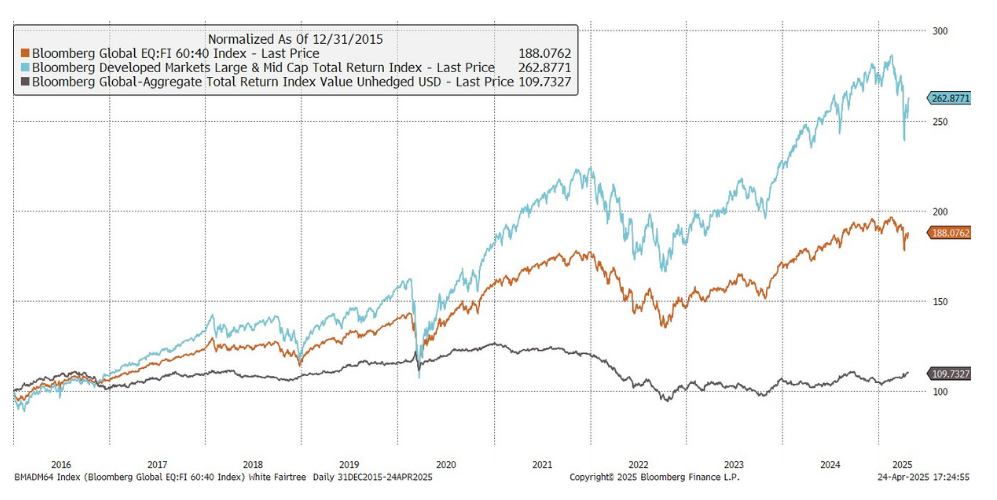
The 2022 market environment and subsequent investor (or client) experience helped reinforce the benefit of hedge fund investing as a strategy that offers positive excess returns with little co-movement to major asset classes.
The main benefit of allocating to a hedge fund has historically been an argument for excess return and downside protection (i.e. hedging). However, a positive excess return argument is only one half of the benefit. The real benefit lies in the uncorrelated nature of the asset class returns when combined with a traditional portfolio which ultimately adds a layer of additional excess return in addition to downside protection. It’s this benefit, and this benefit alone, that make hedge funds a true “free lunch” in not only diversifying a portfolio but also differentiating it.
Figure 3 reinforces both the evergreen case for hedge funds and their timely appeal in the current investing climate. In a hypothetical exercise based on historical equity and fixed income performance, the heatmap shows that a strategy offering classic hedge fund returns would warrant a material allocation, even if it were expected to deliver a modest positive Sharpe Ratio (a measure of excess return for each additional unit of risk). In a climate of correlated stock and bond returns (as we observed in recent years as correlations converge), the optimal allocation grows larger because the hedge fund’s diversification benefit increases.
Figure 3: The benefits of hedge funds
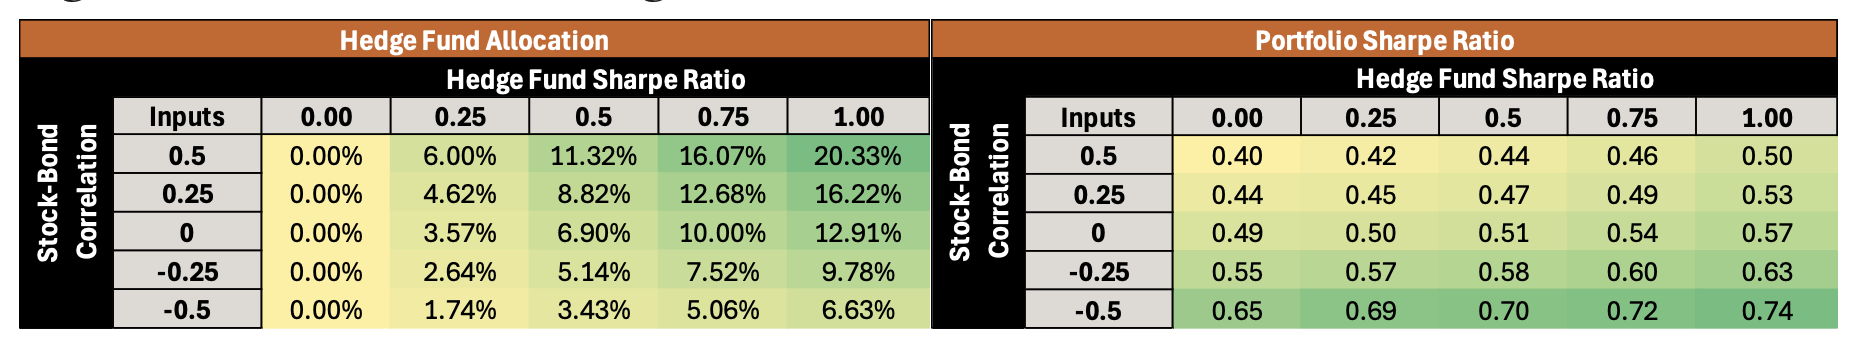
Source: Fairtree. For illustrative purposes only. Assumptions: equity and bond excess returns based on historical averages, hedge fund volatility set at 8%, hedge funds assumed to be uncorrelated to both stocks and bonds.
To deliver these ideal attributes, it makes sense to diversify across several hedge fund strategies that have distinct performance drivers which produce largely uncorrelated return streams. In addition to greater capacity, benefits include reduced volatility; less lumpy payoffs and smaller drawdowns which improve expected risk-adjusted performance (as long as adding incremental strategies is not overly dilutive to expected returns).
The left panel of Figure 4 below shows that aggregating even a small number of sub-strategies achieves significant diversification benefits—if they are truly differentiated. The right panel illustrates the benefit in another way, showing that a small set of distinct hedge fund strategies with individually modest Sharpe Ratios can be combined to generate much stronger risk-adjusted performance. It is not the number of strategies perse that add portfolio diversification benefits, but the additional layer of correlations between them. If each strategy has an additive excess return (Sharpe), where the incremental addition of strategies does not dilute expected returns, this translates into significant improvements in expected risk-adjusted performance.
Figure 4: Portfolio benefits of uncorrelated strategies
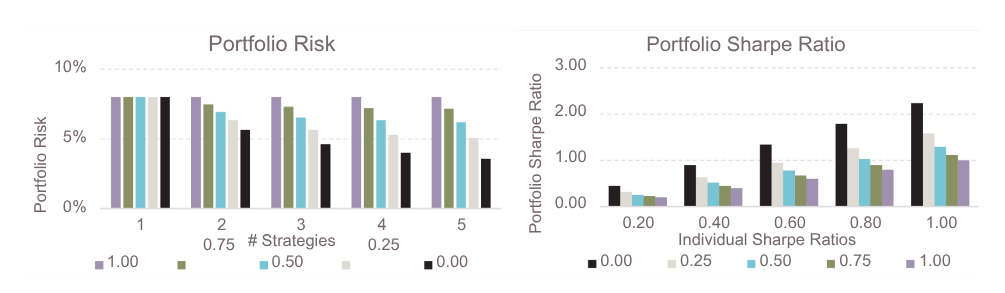
Source: Fairtree. For illustrative purposes only.
The multi-manager structure can be viewed as a pragmatic compromise in aggregating siloed investment processes. It preserves decentralized decision making by specialist sub-strategy, or allocation, teams with respect to trade analysis, sizing and timing, while generating benefits from consolidation in other parts of the investment process.
The Holy Grail – Uncorrelated Diversification
Ray Dalio famously quoted that the “Holy Grail” of investing is achieved when you “can reduce your risk without reducing your return”. Dalio uses this phrase to describe the ideal investment strategy, centred around the principles of diversification. He takes it one step further by asserting that diversification isn’t enough, but rather a focus on distinctly different assets, as he advocates for investing in a mix of assets that have a low correlation between them.
Figure 5: Diversification benefits of uncorrelated strategies
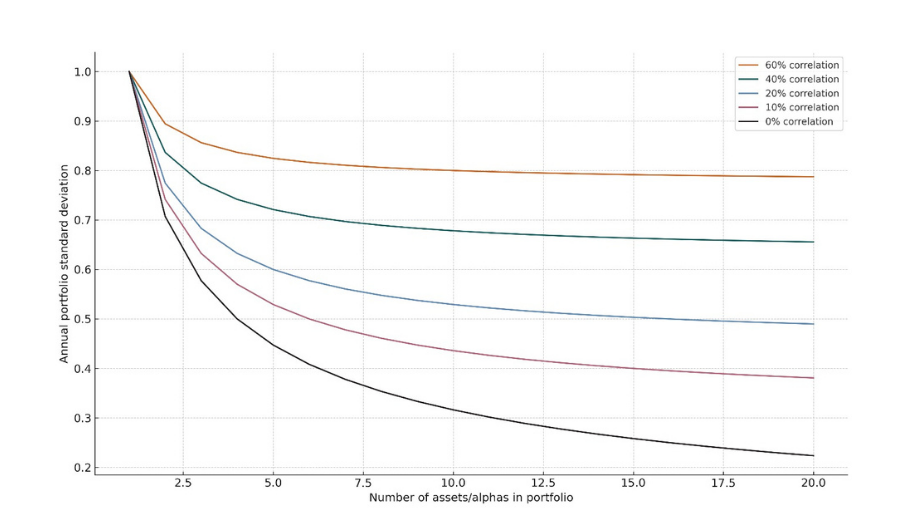
Source: Fairtree, Ray Dalio, Bridgewater
In Figure 5 above, he illustrates this point by plotting different risky portfolios with static expected returns. As you add to the number of assets (x-axes), the result is a declining annual portfolio standard deviation (a measure of risk, on the y-axes). However, when considering the correlation between the assets, he illustrates through the multi- coloured lines of different asset correlations that as the correlation decreases between assets, how that significantly shifts the risk profile down whilst keeping the returns the same – thereby significantly increasing the risk-adjusted return (or Sharpe ratio). Ultimately, he explains that the probability of losing money diminishes as correlation between holdings decreases. Also worth noting how the incremental diversification benefit diminishes roughly when reaching 20 assets, irrespective of the underlying correlation of the asset returns.
However, from a portfolio construction theory perspective, and implicitly of utmost importance to allocators, this dynamic does not only produce a risk-diminishing benefit but rather forms the essential building blocks to generating long-term returns, as the oscillating underlying strategy return series’ compound returns over time. Using a Monte Carlo simulation, we can test this statistically to help explain the benefits of a multi-strategy approach. A Monte-Carlo simulation is a computational probability analysis tool, that models the most likely probability of an outcome based on repeated random sampling. In practice, a Monte-Carlo simulation model repeatedly runs (millions of) sample tests using a set of variables (but using different random combination thereof), to generate simulations of possible outcomes to essentially guide towards the most likely outcome. In the context of investing, it allows you to model a portfolio’s potential return paths under a wide set of scenarios whilst incorporating volatility; correlation; expected returns amongst other inputs. The simulation thereby quantifies the likelihood of millions of various combinations resulting in outcomes to ultimately reach the most likely outcome.
A simple real-life example of a Monte Carlo simulation can be seen in estimating pizza delivery times. Rather than assuming a fixed delivery time, you can simulate a wide range of possible scenarios by accounting for variables like traffic conditions; cooking time and delivery routes etc.—each of which can vary randomly. By running millions of simulations that randomly combine these factors, the model generates a distribution of possible outcomes and find that in 84% of cases the pizza is delivered in under 30min vs 16% of the times it’s late. This allows you to estimate, for example, the probability that your pizza arrives in under 30 minutes, rather than relying on a single average guess.
Figure 6 below is a Monte Carlo simulation of a portfolio returns over time, using the following inputs:
– a single strategy (Strategies = 1),
– generating returns at a Sharpe ratio of 0.5 (Sharpe = 0.5), meaning for every 1 unit of risk, or volatility, you’re earning 0.5 units of excess return.
– a portfolio generating expected returns at 14% annualised volatility (Vol = 14%) which is a measure of the spread of the distribution of return series.
– a time horizon of 20 years (Time =20).
The result: a portfolio generating a modest annual return of 7.42% over 20 years, albeit with reasonable levels of volatility, leading to a portfolio starting value of 100 compounding to 418.51 over the period.
Figure 6: Single strategy portfolio
(Strategies = 1, Sharpe = 0.5, Vol = 14%, Time =20)
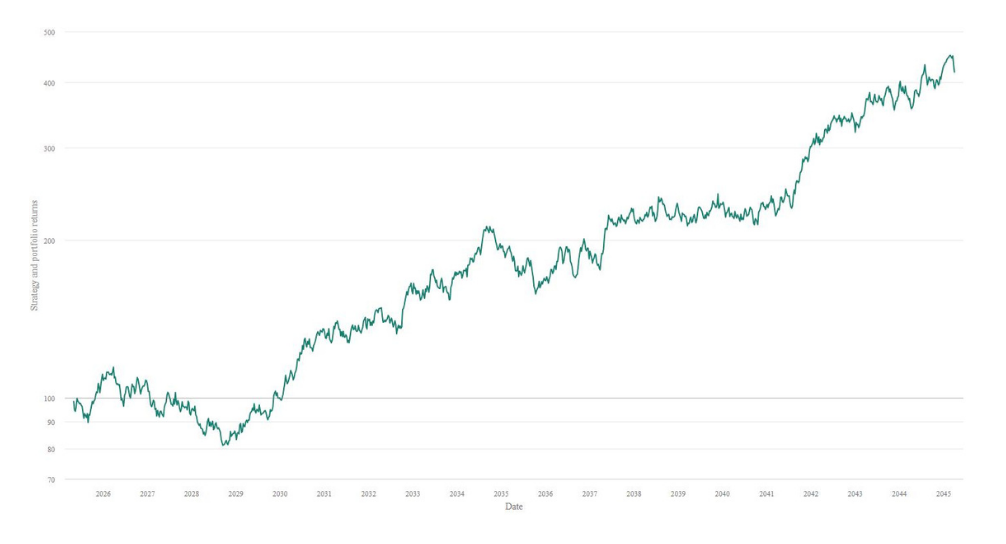
Source: Fairtree, Winton Group.
We can run the same simulation, but as opposed to a single outcome based on a single asset return series, we duplicate the series for 20 random portfolios, each with exactly the same underlying input variables. We can then combine these multiple series into a single portfolio, i.e., creating a multi-strategy fund that consists of an equal weighting to 20 underlying strategies and set a correlation coefficient of 0.4 between the return series (coincidentally, similar to the Wild Fig multi-strategy sub-strategies’ correlation of underlying returns).
The results are as per below: each individual series performs as expected over time, generating a similar return series albeit at different levels of probable success, but notably, the multi-strategy portfolio outperforms all the underlying individual series, increasing portfolio annualised return to 11.80%, at a Sharpe ratio of 0.80.
As the uncorrelated combination of the underlying return series add differentiated excess returns, the multi-strategy captures the oscillating returns on an equal basis, smoothing out the return path over time (lowering the drawdowns) and capturing incremental out performance, which results in an absolute outperformance versus all other strategies. A portfolio with a starting value of 100 would compound to 930.76 over the period.
Figure 7: Multi-strategy portfolio
(Strategies = 20, Sharpe = 0.5, Vol = 14%, Time =20, Corr = 0.4)
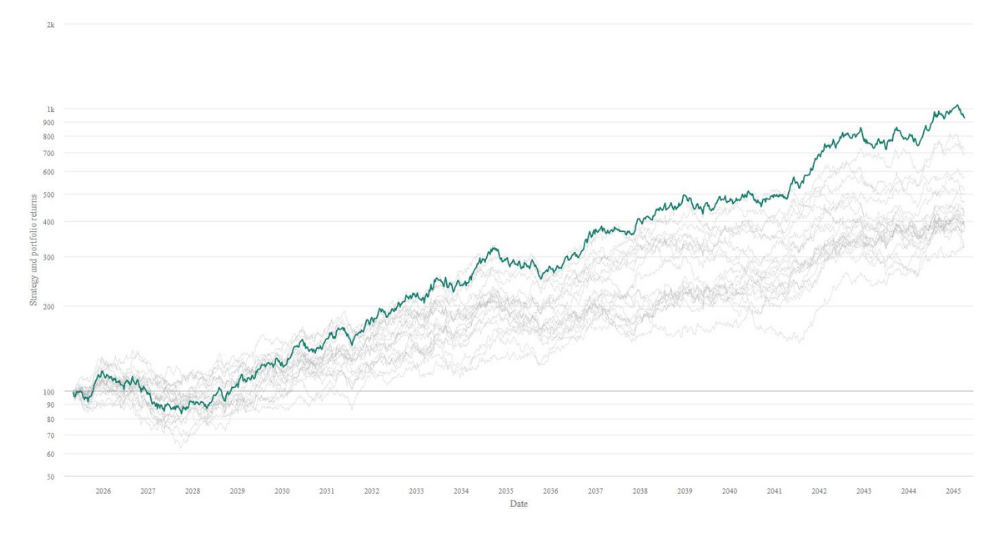
Source: Fairtree, Winton Group.
A common investor misconception is that one can improve returns by lowering the volatility of returns, where volatility is seen as a synonym for risk and clearly when one lowers risk the ultimate return should improve.
However, when lowering the volatility, the shape of the return series remains the same (as seen on the below Figure 8 graph) as volatility does not change the direction of returns, but rather the spread at which they’re generated. Interestingly though, even though the shape remains the same the investor isn’t rewarded for the lower volatility experience, quite the opposite. As the portfolio Sharpe remains the same (0.80), but annualised returns decline to 6.58%, a portfolio with a begin value of 100 would compound to 357.7 over the 20-year period.
Figure 8: Lower volatility multi-strategy portfolio
(Strategies = 20, Sharpe = 0.5, Vol = 8%, Time =20, Corr = 0.4)
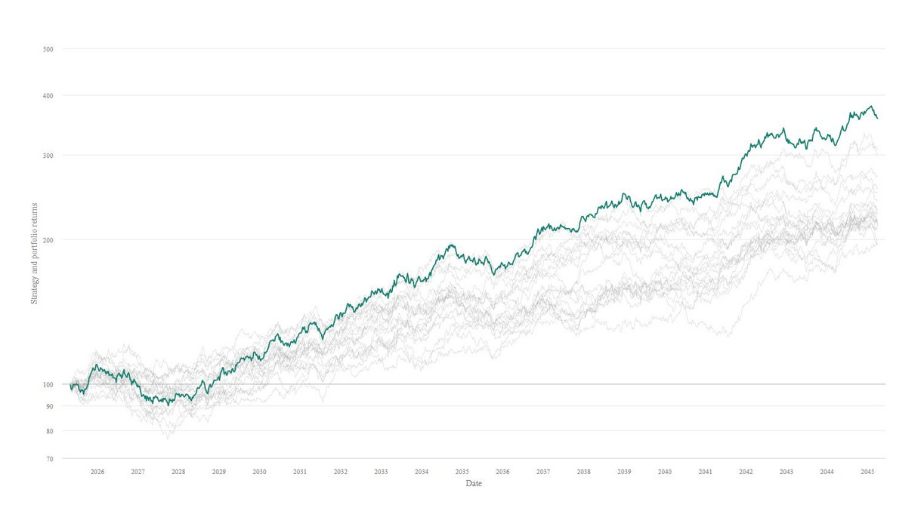
Source: Fairtree, Winton Group.
When turning the dial on the underlying return series’ correlation however, the results are staggering. By removing any correlation (i.e., they have complete uncorrelated returns) the benefits are clear: the portfolio achieves a Sharpe of 2.21, generating an annual return of 36.27% over 20 years, or phrased differently, a starting value of 100 compounds to 48,753.42. As all the strategies are uncorrelated but running an annualised volatility of 14% (taking risk), these risks interplay over time; negating individual downside losses per individual strategy when losses occur and generating additive excess returns.
Figure 9: Uncorrelated multi-strategy portfolio
(Strategies = 20, Sharpe = 0.5, Vol = 14%, Time =20, Corr = 0.001)
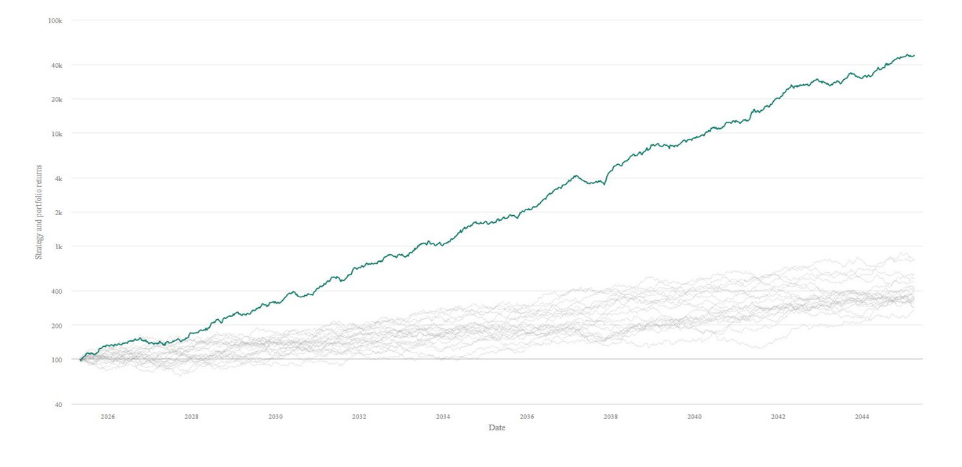
Source: Fairtree, Winton Group.
Conclusion
The central belief within the Wild Fig Multi Strategy lies in the pursuit of the so called “holy grail” of investing whereby uncorrelated asset classes and subsequent sub-strategies are combined into a single-entry point for investors with the goal of delivering absolute returns each year irrespective of market conditions without taking excessive risk.
The Wild Fig multi-strategy range of funds is built on exactly this notion, with a focus on skilled internal, best in class Fairtree underlying strategies. The Wild Fig Portfolio Management team sets out to find multiple uncorrelated return series and constantly track and monitor the underlying correlations as: macro conditions change; strategies mature, and they aspire to take advantage of current investment opportunities available to them.
This uncorrelated blend of the sub-strategy allocations has resulted in the fund achieving its target objective of “generating absolute returns, whilst exhibiting JSE All Share volatility”, achieving a return of 20.8% since inception over c.15 years ago – or a portfolio with a begin value of 100 would have compounded to 1,590. Over the same period, the JSE All Share has delivered a return of 11.7%.
Once again, thank you for your support and your trust as custodians of your capital.
Please do not hesitate to reach out with any questions or comments.
Wild Fig FR Multi Strategy QIHF cumulative performance
Topics
Values-driven investing
Download the fund factsheet
Download the montly fund factsheet to view comprehensive information and performance data.


We are Fairtree
Subscribe to our newsletter
Stay informed with the latest insights and updates. Subscribe to our newsletter for expert analysis, market trends, and investment strategies delivered straight to your inbox.

"*" indicates required fields

FAIRTREE INSIGHTS
You may also be interested in
Explore more commentaries from our thought leaders, offering in-depth analysis, market trends and expert analysis.


Macro Pulse Episode 21
In this episode Jacobus discusses SA equities, SA bonds and the appreciating of the US dollar.


Fairtree Market Insights with Karena Naidu | Episode 8
In this episode, we dive into our Chinese exposure, exploring what’s happening with the major e-commerce players in China. We also take a closer look at the broader emerging markets space, unpacking key trends and where we’re seeing potential growth.

Macro Pulse Episode 20
In this episode, Jacobus discusses major events leading up to year-end, recent US court cases, and the rise in long bond yields.
Disclaimer
Collective Investment Schemes are generally medium to long-term investments. The value of participatory interests
(units) may go down as well as up.
Past performance is not necessarily a guide to future performance. Collective
investments are traded at ruling prices and can engage in scrip lending and borrowing. A schedule of fees, charges,
minimum fees, and maximum commissions, as well as a detailed description of how performance fees are calculated
and applied, is available on request from FundRock Management Company (RF)(Pty) Ltd (“the Manager”). The
Manager does not provide any guarantee in respect to the capital or the return of the portfolio. The Manager may close
the portfolio to new investors in order to manage it efficiently according to its mandate. The Manager is registered and
approved by the Financial Sector Conduct Authority under CISCA. The Manager retains full legal responsibility for the
portfolio. The investment performance is for illustrative purposes only.
About you…
By proceeding, I confirm that:
- To the best of my knowledge, and after making all necessary inquiries, I am permitted under the laws of my country of residence to access this site and the information it contains; and
- I have read, understood, and agree to be bound by the Terms and Conditions of Use described below.
- Please beware of fraudulent Whatsapp groups pretending to be affiliated with Fairtree or Fairtree staff members.
If you do not meet these requirements, or are unsure whether you do, please click “Decline” and do not continue.