Market Insights | Market Share Dynamics of Energy Drinks


By Cornelius Zeeman and Thembinkosi Kweyama,
Fairtree Portfolio Manager and Equity Analyst
In our previous article on energy drinks, we explored the rise of this drink category in the global liquid refreshment beverage sector. Despite their niche status in the US non-alcoholic and alcoholic beverage markets, energy drinks have secured a 2% market share by volume and 4% by dollar sales. Over the past two decades, this market has been dominated by a duopoly, with Monster Energy and Red Bull collectively commanding over 65% of volume and dollar sales, as shown in Graph 1. Meanwhile, carbonated drinks and bottled water drive significant volumes, while beer and spirits lead in dollar value.
Graph 1: Beverage market share in the US market
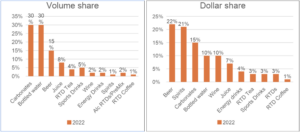
Source: BoFA
Different types of energy drinks.
The US market has been a testing ground for product innovations by brands like Red Bull and Monster Energy. Recently, Celsius has gained popularity among gym enthusiasts and health club members, positioning itself strongly within the performance energy drink category. Performance energy drinks are generally low in sugar but high in caffeine, promising benefits such as increased metabolism for up to three hours, as marketed by Celsius. This innovation has driven the performance energy drink segment to a 21% market share, largely due to Celsius’s positioning as a wellness beverage in the low-sugar category.
Graph 2: Drivers of incremental consumption (May 2022 wave)
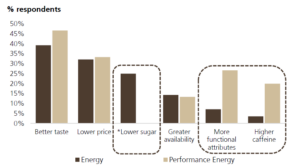
Source: UBS survey
Table 1 below shows Nielsen data that track market share trends in dollar sales and volumes in convenience and retail channels since April 2019. Note: Monster Energy brands are highlighted in grey, including the newly acquired Bang brand.
Table 1: Nielsen market share trends in US$ sales and volumes
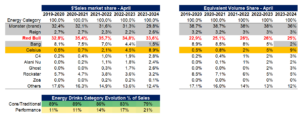
Source: Nielsen Data
Distribution dynamics.
Table 2 below shows that Monster Energy’s core products are typically more affordable than their competitors, partly because their cans are usually twice the size of a Red Bull can. This size difference explains the disparity between their dollar and volume shares. Another key factor is the variety of products available per store. Effective distribution plays a crucial role here. Celsius’s substantial market presence is bolstered by its partnership with PEPSICO, initiated last year, while Monster Energy has been leveraging the Coca-Cola Bottling Network since 2015 for its international expansion.
Table 2: Pricing and products in store shelves by the respective companies
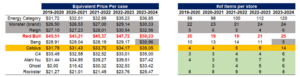
Source: Nielsen Data
Conclusion.
The energy drink category has outperformed other beverage categories, and this will likely continue. Category shifts and innovation in the market are seeing new entrants like Celsius come in and partnering up with Pepsi for distribution to cement their share on the retail shelves. Strategic distribution partnerships and brand positioning are vital, as evidenced by the distinct paths taken by leading brands to engage consumers.
Topics
We are Fairtree
Subscribe to our newsletter
Stay informed with the latest insights and updates. Subscribe to our newsletter for expert analysis, market trends, and investment strategies delivered straight to your inbox.

"*" indicates required fields

FAIRTREE INSIGHTS
You may also be interested in
Explore more commentaries from our thought leaders, offering in-depth analysis, market trends and expert analysis.


Macro Pulse Episode 21
In this episode Jacobus discusses SA equities, SA bonds and the appreciating of the US dollar.


Fairtree Market Insights with Karena Naidu | Episode 8
In this episode, we dive into our Chinese exposure, exploring what’s happening with the major e-commerce players in China. We also take a closer look at the broader emerging markets space, unpacking key trends and where we’re seeing potential growth.

Macro Pulse Episode 20
In this episode, Jacobus discusses major events leading up to year-end, recent US court cases, and the rise in long bond yields.
Disclaimer
Fairtree Asset Management (Pty) Ltd is an authorised financial services provider (FSP 25917). Collective Investment Schemes in Securities (CIS) should be considered as medium to long-term investments. The value may go up as well as down and past performance is not necessarily a guide to future performance. CISs are traded at the ruling price and can engage in scrip lending and borrowing. A schedule of fees, charges and maximum commissions is available on request from the Manager.
A CIS may be closed to new investors in order for it to be managed more efficiently in accordance with its mandate. Performance has been calculated using net NAV to NAV numbers with income reinvested. There is no guarantee in respect of capital or returns in a portfolio. Prescient Management Company (RF) (Pty) Ltd is registered and approved under the Collective Investment Schemes Control Act (No.45 of 2002). For any additional information such as fund prices, fees, brochures, minimum disclosure documents and application forms, please go to www.fairtree.com
About you…
By proceeding, I confirm that:
- To the best of my knowledge, and after making all necessary inquiries, I am permitted under the laws of my country of residence to access this site and the information it contains; and
- I have read, understood, and agree to be bound by the Terms and Conditions of Use described below.
- Please beware of fraudulent Whatsapp groups pretending to be affiliated with Fairtree or Fairtree staff members.
If you do not meet these requirements, or are unsure whether you do, please click “Decline” and do not continue.