Fairtree Global Flexible Income Plus Fund Q4 2024 Commentary


Market dynamics
Global risk
The fourth quarter witnessed a turnaround in the relative performance of large-cap to medium-cap indices. The Dow Jones Industrial Average posted a sub-par 0.93% over the period, underperforming the resurgent tech-heavy NASDAQ, which recovered from its underperformance in the previous quarter. The NASDAQ produced a rather pleasing 6.36% in USD, which ranks as the 31st best quarter since Q2 2007 or a dataset consisting of 71 quarters. As has become the norm for some time, North American equities outperformed their European and British counterparts, which is not that surprising given the more socialist-leaning policies that have been adopted in both Europe and the UK. Unfortunately for the UK, which has recently elected a less market-friendly government, the FTSE showed a negative quarter, destroying some 0.18%, and that looks to be about as good as it is going to get over the next few years. One must assume that this is fully discounted, considering that the Chancellor of the Exchequer spent more time changing artworks in No. 11 rather than focussing on realistic and deliverable fiscal policy. The solution to labour problems cannot be to nationalise and pay higher salaries, but market fear is that this is merely a taste of what the future has in store for the ever-diminishing British taxpayer. In their defence, they did inherit an already wobbly system, which had slowly degraded over the past decade, but the market will be watching the policy choices of the new decision-makers with keen attention.
Moving to European credit, the iTraxx suite of indices produced more numbers in the black, with the bellwether 5-year Crossover index (75 equally weighted global sub-investment grade names) producing a rather healthy 1.59%, comfortably outperforming cash. Our more favoured two-time levered index produced an even better number at a 2.36% gain, comfortably outperforming the majority of equity indices. It is most interesting to note that European Credit outperformed European equity indices with the exception of the German Dax index which produced 3.02% or the 37th-best rank over the 71 quarterly historic datasets.
Table 1: Major Index Q4 2024 Total Return and historical rankings Q2 2007 – Q4 2024
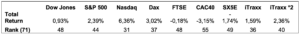
Source: Bloomberg (31 December 2024)
Given the fact that we have 17.75 years of quarterly data, we can do more than just look at the performance numbers as well as the relative rankings. We can also look at relative risk measures such as standard deviations, Sharpe Ratios (SR) and other measures of risk-adjusted returns. This should be important to investors who do “feel” risk in the diffusion of the performance that they have delivered. For the same absolute return in a portfolio, only a fool would be happy with more risk for that return than less risk. There are many definitions of what risk is, and what is important for one investor is quite different from another, but we feel that the most consistent and comparable is the time-tested standard deviation, which has its roots in its mathematical construct. This makes it totally consistent in its treatment of any distribution of potential outcomes. The simple calculation of mean divided by standard deviation gives a good measure of risk-adjusted return and is one that we tend to like to look at. This is not the SR, as the SR strips out risk-free return as well as the volatility of that risk-free return, but we feel that the basic return per unit risk ratio is a good proxy for the slightly more rigorous SR. Obviously, a higher number is better as the investor receives more return for his accumulated risk. We must be aware, however, that a high number on its own cannot be viewed as the “Holy Grail”, since any low volatility index might deliver high levels of Return Coefficient but might not deliver that much by way of return. For example, it might be foolish to buy an index that produces a 0.4% annual return with a 0.2% annualised volatility – a return coefficient of 2, rather than an index that produces a 12% return with a standard deviation of 8%.
Table 2 shows the annualised returns, the annualised risk as well as the return coefficients for the major indices that we monitor. These numbers are generated from our historical dataset and therefore do include risk periods such as the Global Financial Crisis (GFC), the Greek Government default crisis, the COVID-19 global pandemic, the more recent Ukraine/Russian war as well as the current war in the Middle East and all the political turmoil in Europe the UK and the US. Perhaps it is more of the same rather than the exception at the moment, with the world as usual, teetering on the brink of the potential for some financial fallout, but the traditionalist would suggest that this potential for fallout is the very reason that risk premia exist in the first place. No risk should have risk-free returns; those who choose to take the risk of loss should surely be rewarded for doing so. This line of argument would go a long way in explaining persistence in market returns; the “overvaluation” of US equities has been bandied around for the last 2 decades, and yet they continue to outperform their European counterparts. Contrary to popular opinion, the outperformance will more than likely continue until participants accept it as the “new normal”. And when that eventually happens, it will probably be followed by a reversal of fortunes.
From a European perspective, Table 2 highlights the outperformance of credit from a risk-adjusted perspective. In fact, the more risk normalised two times levered index solidly outperforms its equity equivalent, offering investors excess return for a given risk target. If an investor is comfortable with equity-type risk, they should be more than happy with the extra return that iTraxx*2 has offered. This index goes a long way to close the relative gap to US equities and provides a rather good fund diversifier to the allocator that has a US strategic overweight.
Table 2: Index Risk Adjusted Return Co-efficient
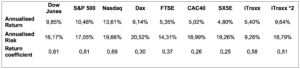
Source: Bloomberg (31 December 2024)
As an extension of last quarter’s report, Figure 1 below shows the cumulative return of the various indices in the currency of the particular index domicile. The various performance traces were indexed to 100 at the beginning of the second quarter of 2007 when we have the complete historical data for the iTraxx XOver and Main total returns.
When looking at Figure 1, it also becomes apparent that there are no returns risk-free. The worst performing traces over the 17.75 years are the iTraxx Main Index (125 equally weighted global investment-grade credit names) and the US Treasuries Total Return Index. Looking at the delivered risk, it becomes apparent that US Treasuries are not the least risk asset class but rather the well-diversified investment-grade CDS index – iTraxx Main. Lowest returns but the lowest associated risk over the past 17.75 years.
Figure 1: Major Index Total Return Q2 2007 – Q4 2024
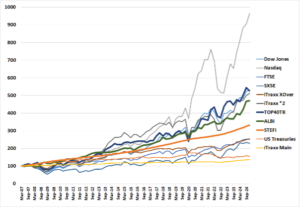
Source: Bloomberg (31 December 2024)
It is difficult to look at the returns and the associated volatility of those returns simultaneously in Figure 1. To disentangle the graphic and the more meaningful comparatives, we produce the delivered risk (as computed by the annualised standard deviation of quarterly returns) as well as the delivered annualised return over 17.75 years. This is shown in Figure 2. If we were to fit a straight line to this dataset, we would observe an upward slope indicating that there is a positive return to risk. Increase that risk, and it should result in a higher delivered return. The corollary of this is also apparent: a reduction in risk will result in a reduced overall delivered return. The textbooks, which have always stated that there needs to be an excess return to risk, are indeed correct.
Figure 2: Major Index Risk Return scatterplot Q2 2007 – Q4 2024
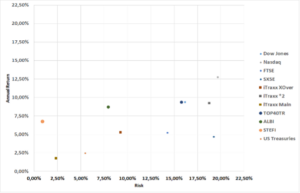
Source: Bloomberg (24 December 2024)
The domination in return terms of US equities, which was touched on earlier in this piece, is quite apparent in the figure, but one must be cognisant of the fact that these indices are shown in local currency.
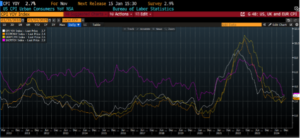
Moving to the economic backdrop, Figure 3 shows inflation in the developed world (the US, UK, Eurozone and South Africa), highlighting the fact that inflation is well off its highs hit in the fourth quarter of 2022. The fact that the disinflationary trend, which started in the US, seems to have slowed down and has resulted in a more cautious response from the central banks.
The Fed did start its long-awaited cutting cycle, lowering its target rate by 50 bps at the September meeting and following it up with two more 25 bps cuts at the November and December meetings. We consider the Fed response to be about correct and contend that the extent of this cutting cycle, given the newer data, should be between 150-200 bps, which has trimmed about 50 bps from our previous forecast. Obviously, as is always, the case, the Fed response will always be data dependant and with inflation remaining stubbornly high as well as the jobs market suggesting that labour conditions could be construed as being “tight”, we think that the cutting cycle will be curtailed somewhat, but we are certainly not in the camp that is suggesting that the cutting cycle has now been completed.
Figure 3: Annual Change in Consumer Price Indices
Source: Bloomberg (31 December 2024)
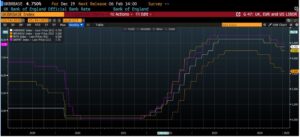
Figure 4 below shows the level of short rates as administered by the US Federal Reserve, the European Central Bank, the Bank of England and the South African Reserve Bank. What is interesting to note is the high levels of correlation in both the direction as well as the extent of policy settings.
Figure 4: Central Bank Administered Rates
(Source: Bloomberg as at 31 December 2024)
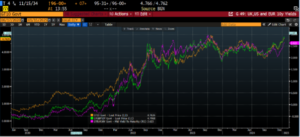
Figure 5 shows the movements in global bond yields. It shows the 10-year US Treasury, the UK Gilt, and the benchmark European Bund, albeit using 2 different scales.
It is interesting to note the high levels of correlation between these three traces and that although short-term disconnects tend to take place, they are generally swiftly reversed.
Figure 5: 10-year benchmark yields in the US,UK and EU
(Source: Bloomberg as at 31 December 2024)
Fund performance
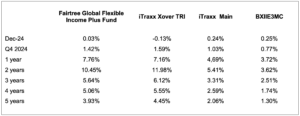
The strategy of the Fund is to provide investors access to a well-diversified credit portfolio that aims to outperform its benchmark over the long term. Table 3 shows the total performance of the Fairtree Global Flexible Income Plus Fund relative to iTraxx XOver Total Return Index, the investment grade iTraxx Main Total Return Index, as well as the Barclays 3-month EURIBOR cash index. The indices are inclusive of re-invested coupons and interest whilst the Fund performance is inclusive of all fees. One should take note that the indices carry no fees whilst the fund performance is in accordance with Class A, which has a TER of 0.95% per annum as currently reported by Bloomberg. As pointed out in the last quarterly report, the Fund is particularly defensive at the moment, with a lower-than-benchmark delivered risk metric. The annualised standard deviation of daily returns of the index for calendar 2024 basis is around 4.31%, whilst the Fund has delivered 3.39% risk on a like-for-like basis. Given the current spread level of the index and the associated potential for excess returns, the managers feel quite comfortable running low risk at the moment. We will look to extend risk once the spread kicks above the 350-basis point level.
Table 3: Fairtree Global Flexible Income Plus Fund historic total returns to end Q4 2024
Source: Bloomberg (31 December 2024)
A few things become quite apparent, and even a touch startling, when analysing the table.
-
- The Fund had a good quarter, generating 1.42% on an outright basis and outperforming the investment grade iTraxx Main index by 0.39% on an after-all fees basis.
- Except for December, the Fund has outperformed the Barclays 3-month EURIBOR Cash Index over all measurement periods.
- The Fund, despite its defensive positioning, has outperformed iTraxx XOver by around 0.60% for the calendar year 2024.
- Over the past five years, the Fund has underperformed its benchmark index by around -0.51% in total return net of fees of the most expensive class of the Fund.
- Given the Fund’s strategic nature, it tends to underperform in strong bull markets but outperforms during periods of higher equity volatility, making it a risk diversifier.
- iTraxx XOver has outperformed iTraxx Main over all measurement periods, indicating that there is a return to risk.
Looking to the first quarter of 2025, the Fund spread to EURIBOR is currently at 362 bps. With the 3-month EURIBOR sitting at 2.71%, we have a current yield on the Fund of around 6.33% on a pre-fee basis. This compares favourably with the benchmark, which has a current yield of around 5.84%.
The Fund is currently well diversified, holding some 41 instruments with 356 underlying obligors. The Top 10 instrument holdings make up around 43.6% of the Fund. The Fund currently has high levels of liquidity, with around 11% of unencumbered cash in the Fund. We have no large upcoming maturities for the Fund; the next maturity is due in March, so the managers are not under any pressure to deploy excess capital at any price. The good news, however, is that due to the large cash component, the managers have plenty of risk appetite for any global sell-off. The managers have been very patient to date, a luxury that they have due to the excess spread on the fund relative to the benchmark at present.
The managers feel quite comfortable with the Fund’s shape and risk position at the moment, given the geopolitical risks that currently abound. We fundamentally believe that capital preservation is the name of the game at present and do not feel any pressure to up risk to squeeze the last slither of value in the current markets. Investing is a tactical game of patience, and our client base should be comfortable knowing that their assets are not chasing short-run benchmark performance.
Topics
Values-driven investing
Download the quarterly report
Download the quarterly report to view comprehensive information and performance data.


We are Fairtree
Subscribe to our newsletter
Stay informed with the latest insights and updates. Subscribe to our newsletter for expert analysis, market trends, and investment strategies delivered straight to your inbox.

"*" indicates required fields

FAIRTREE INSIGHTS
You may also be interested in
Explore more commentaries from our thought leaders, offering in-depth analysis, market trends and expert analysis.


Wild Fig Multi Strategy Hedge Fund Q2 Investor Update
Quarter 2 headlines were driven by Trump 2.0 and his policies surrounding the US tariff trade stance, the ensuing widespread global market sell-off and the subsequent 90-day pause that triggered a sharp reversal of these losses.

Fairtree Global Flexible Income Plus Fund Q2 2025 Commentary
After the very slow start for US equities during the first quarter, and the superior performance emanating from the EU and the UK, the second quarter witnessed a turnaround in fortunes with the tech-heavy NASDAQ delivering its fourth-best quarterly performance number over the past 18 years.


Fairtree SA Equity Prescient Fund Q2 2025 Commentary
During Q2, Bonds increased by 5.9% and Cash returned 1.9%. The MSCI Emerging Market Index increased by 11.9% (in USD), outperforming the MSCI World Index, which increased by 11.4% (in USD). The MSCI South Africa Index increased by 13.6% (in USD).
Disclaimer
Fairtree Asset Management (Pty) Ltd is an authorised financial services provider (FSP 25917). Collective Investment Schemes in Securities (CIS) should be considered as medium-to-long-term investments. The value may go up as well as down and past performance is not necessarily a guide to future performance. CISs are traded at the ruling price and can engage in scrip lending and borrowing.
A schedule of fees, charges and maximum commissions is available on request from the Manager. A CIS may be closed to new investors in order for it to be managed more efficiently in accordance with its mandate. Performance has been calculated using net NAV to NAV numbers with income reinvested. The performance for each period shown reflects the return for investors who have been fully invested for that period. Individual investor performance may differ as a result of initial fees, the actual investment date, the date of reinvestments and dividend withholding tax. Full performance calculations are available from the manager on request. There is no guarantee in respect of capital or returns in a portfolio. Prescient Management Company (RF) (Pty) Ltd is registered and approved under the Collective Investment Schemes Control Act (No.45 of 2002). For any additional information such as fund prices, fees, brochures, minimum disclosure documents and application forms please go to www.fairtree.com
The Fairtree Global Flexible Income Plus Fund is registered and approved by the FSCA under section 65 of CISCA. Highest rolling one-year return 20.32% (Benchmark 17.74%) and lowest rolling one-year return -12.84% (Benchmark: -11.56%) information to 31 December 2024. The fund has returned an annualised return of 4.35% since inception (January 2019) (Benchmark: 4.52%). The fund’s annualised performance over 1-year is 7.76% (Benchmark: 7.16%). The fund’s annualised performance over 3-year is 5.64% (Benchmark: 6.12%). The fund’s annualised performance over 5-years is 3.94% (Benchmark: 4.450%). Fund returns disclosed are annualised returns net of investment management fees and performance fees. Annualised return is weighted average compound growth rate over the period measured. Fund investment risk indicator level: moderate. Full performance calculations are available from the manager on request. Annualised performance: Annualised performance shows longer term performance rescaled to a 1-year period. Annualised performance is the average return per year over the period. Actual annual figures are available to the investor on request. Highest & Lowest return: The highest and lowest returns for any 1 year over the period since inception have been shown. NAV: The net asset value represents the assets of a Fund less its liabilities. Inception date: January 2019.
This document is confidential and issued for the information of the addressee and clients of Fairtree Asset Management only. It is subject to copyright and may not be reproduced in whole or in part without the written permission of Fairtree Asset Management. The information, opinions and recommendations contained herein are and must be construed solely as statements of opinion and not statements of fact. No warranty expressed or implied, as to the accuracy, timeliness, completeness, fitness for any particular purpose of any such recommendation or information is given or made by the Manager in any form or manner whatsoever. Each recommendation or opinion must be weighed solely as one factor in any investment or other decision made by or on behalf of any user of the information contained herein, and such user must accordingly make its own study and evaluation of each strategy/security that it may consider purchasing, holding or selling and should appoint its own investment or financial or other advisers to assist the user in reaching any decision. The Manager will accept no responsibility of whatsoever nature in respect of the use of any statement, opinion, recommendation, or information contained in this document. This document is for information purposes only and does not constitute advice or a solicitation for funds.
About you…
By proceeding, I confirm that:
- To the best of my knowledge, and after making all necessary inquiries, I am permitted under the laws of my country of residence to access this site and the information it contains; and
- I have read, understood, and agree to be bound by the Terms and Conditions of Use described below.
- Please beware of fraudulent Whatsapp groups pretending to be affiliated with Fairtree or Fairtree staff members.
If you do not meet these requirements, or are unsure whether you do, please click “Decline” and do not continue.