Fairtree Balanced Prescient Fund Q1 2025 Commentary


*Net of fees
Source: Prescient, 31 March 2025. Fund inception: January 2017
Benchmark: SA – Multi Asset – High Equity Category Average
Threats, action, reverse and start again
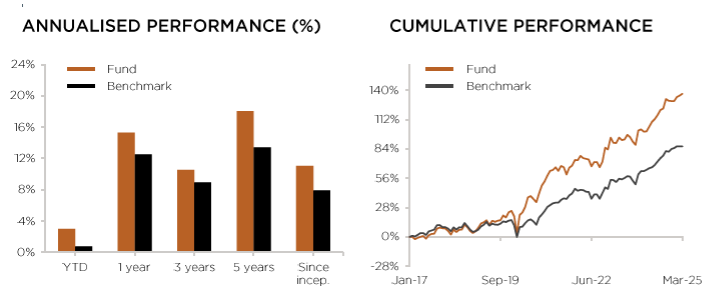
The fund returned 3.01% over Q1-2025 and 15.30% over the last 12 months. The fund outperformed its peer group over the quarter and outperformed over the year. Over 3 and 5 years, the fund continues to be ranked within the top 10% of its peer group. The fund aims to provide investors with significant positive real returns and has outperformed inflation by 5% or more over the last 12 months, 3 years, 5 years and since inception.
We expect macro uncertainty to remain in the markets over 2025. Global investors remain cautious in the wake of shifting geopolitical dynamics and uncertain trade policies. In the US, persistent tariff moves and mixed signals regarding economic policy have dampened confidence, leading market participants to position more defensively. Across Europe, there is a cautiously positive tone fuelled by expansive fiscal stimulus plans and accommodative monetary policies. In emerging markets like China, the sentiment is buoyed by supportive domestic policies, the scope to ease, a weaker US dollar and technological breakthroughs, even as the overall global risk environment remains a restraint.
South Africa’s sentiment is nuanced. While global safe haven flows and a stronger rand signal resilience in response to elevated commodity demand, political uncertainty, and fiscal challenges (Delayed budget) continue to weigh on investor confidence. The cautious stance taken by the South African Reserve Bank, maintaining a steady repo rate following previous rate cuts, highlights the balance between stabilizing inflation and ensuring economic stability. Overall, the market sentiment is one of guarded optimism tempered by structural and political challenges. Risks to growth have moved to the downside.
Our portfolio is well-diversified, liquid and positioned for multiple macro-outcomes. We are cautious and defensively positioned towards developed markets but bold and opportunistic towards emerging markets. We remain overweight government bonds, globally and locally, relative to an underweight in equities, particularly the US. We remain more optimistic about local assets. Our portfolio is well-positioned to weather slowing growth, geopolitical conflict, and sticky inflation. We remain neutral on cash, awaiting signs of a more imminent global economic slowdown. While overall defensively positioned, we have selective offensive positions that will benefit from an improved economic and political environment in China and South Africa.
This environment calls for active portfolio management and flexibility. Our investment approach leans on strong macro top-down analysis complemented by rigorous bottom-up work.
Macro Overview
The first quarter of 2025 was marked by significant market volatility driven by shifting geopolitical dynamics, trade uncertainties, and changing fiscal policies across major economies.
US equity markets faced turbulence due to rising trade policy uncertainty under the administration. February saw the imposition of new tariffs on imports from Mexico, Canada, and China, followed by additional tariffs on steel, aluminium, and autos in March. These, and threads of more tariffs on countries, led to concerns about slowing economic activity, with small business surveys showing a drop in capital expenditure intentions. As a result, the S&P 500 saw declines, particularly in the information technology and consumer discretionary sectors, although energy and healthcare stocks outperformed. The Federal Reserve kept interest rates on hold during the quarter as inflation remained sticky around 3%, but signalled a readiness for future rate cuts, highlighting downside risks to growth.
Despite these challenges, US Treasuries performed well, returning 2.9% as investors sought safety amidst growing recession risks. US 10-year Treasury yields fell to 4.2%.
Europe saw a more positive quarter as fiscal stimulus plans took centre stage. Following Germany’s announcement of almost $ 1 trillion in infrastructure spending and defence budget increases, German Bond yields rose, reflecting improved growth expectations. The European Central Bank cut interest rates twice during the quarter and showed optimism about fiscal expansion, which fuelled gains in European equities. The Eurozone’s DAX Index posted its strongest first quarter since 2023, buoyed by investor optimism around the pro-growth agenda of Germany’s incoming Chancellor, Friedrich Merz.
Emerging markets, particularly China, outperformed developed markets in Q1 2025. Chinese equities rose, supported by a more supportive policy stance from Beijing and optimism following DeepSeek’s AI breakthrough. Despite concerns about US tariffs, Chinese stocks were buoyed by hopes for a more resilient economy.
The UK experienced relatively subdued market movements. Despite a fiscal deterioration, the government’s new spending cuts did little to shake investor confidence, with UK equities outperforming many other regions. However, smaller companies in the UK struggled, as concerns over the domestic economic outlook persisted. In the consumer discretionary sector, retail and housebuilder stocks faced pressure, while larger financial, energy, and healthcare companies benefited.
Commodities were the standout performers in Q1 2025. Gold and silver saw strong gains, with gold up 19%, as investors sought safety amid trade uncertainties and economic growth concerns. The broader commodity complex performed well, especially in energy, where natural gas prices surged. Industrial metals like copper also gained sharply, while agriculture was a weak spot, with cocoa prices falling sharply.
South Africa contended with a volatile macro environment. Globally, geopolitical instability escalated sharply following the inauguration of US President Trump, whose sweeping tariff agenda and confrontational foreign policy rattled markets. Investors pivoted towards safe-haven assets such as gold, driving up prices and supporting South African resource exports, contributing to rand strengthening. South African Reserve Bank (SARB) kept the repo rate unchanged at 7.50% in March, following three consecutive 25 basis point cuts, citing global uncertainty and the need to maintain stable inflation expectations.
The Government of National Unity (GNU) experienced its first major test when the National Budget, initially scheduled for 19 February, was delayed due to disputes over a proposed 2% VAT hike. The final budget, delivered on 12 March by Finance Minister Enoch Godongwana, contained a 0.5% VAT increase for this year and another 0.5% next year. Most encouraging is that the focus of the budget remained on fiscal consolidation. South Africa’s gross government debt is expected to peak at 76.2% of GDP while running a primary budget surplus. On the growth front, GDP expanded by a modest 0.6% in Q4 2024. Retail sales showed strength, up 7% year-on-year, and passenger vehicle sales remain strong at around 25% year-on-year. Manufacturing and mining output remained weak. Treasury expects the economy to grow by 1.9% in 2025.
Market Review
Global equity markets struggled over the quarter. Global equities dropped by 1.8%, while ex-US equities outperformed with 5.2%. US equities underperformed (-4.6%) mostly led by an underperformance of the large consumer technology stocks. The equally weighted S&P 500 was down -0.3% over the quarter, showing how concentrated the US equity rally was for last year. Europe was up 5.9% and Emerging Markets up 2.9%. Within Emerging Markets, China (15%) and South Africa outperformed.
SA Equities (Capped SWIX) was up 5.9% over the quarter. SA Resources was the best performing sector, up 33.7% predominately driven by gold and PGM stocks, while General Retailers dropped 20.3%%. The rand appreciated by around 2.8% over the quarter against the US dollar.
During the quarter, the South Africa All Bond index rose 0.7% and cash returned 1.9%. The Bloomberg Barclays Global Aggregate Bond Index gained 2.9% over the quarter. Global credit also saw an increase of 3.1%.
Commodities were strong in general, with Copper (24%), Gold (19%) and Platinum (10%) the strongest performers. Lumber, Base Metals, and Corn were the only negative performers.
The US dollar weakened 3.9% against the major currencies as policy uncertainty increased and the growth outlook weakened.
Portfolio performance
The fund returned 3.01% over Q1-2025 and 15.30% over the last 12 months. The fund outperformed its peer group over the quarter and outperformed over the year. The fund outperformed relative to its internal index, with both security selection and asset allocation resulting in excess returns over the quarter.
Our security selection within SA Equity, SA Bonds & Global Real Estate detracted from excess returns, while security selection within Global Equities, EM Equities and Commodities contributed to excess returns.
Our SA Equity exposure underperformed the FTSE/JSE Capped Shareholder Weighted (Capped SWIX) Index. The Gold sector was the key performance contributor during Q1 and was positively impacted by positions in Goldfields (67.26%), AngloGold (66.83%), as well as the Discretionary sector with Prosus (12.36%), Naspers (8.26%) and Anheuser (20.54%). Positions in Mr Price (-24.95%), Glencore (-19.44%), Truworths (-27.50%), FirstRand (-5.42%), and Foschini (-26%) detracted from the performance.
Global Equities, Global Real Estate and US Treasuries all underperformed in rand terms. Within Global Equities, our underweight to US equities and in particular large consumer technology stocks worked in our favour as we overweighted Emerging Market and China technology exposures.
Within Commodities, our overweight in Gold contributed to excess returns.
Within asset allocation, our decisions to be overweight SA Equity, Emerging Market Equity, and Commodities and underweight Global Equity worked in our favour, while being overweight Global Bonds detracted.
Portfolio positioning
In this environment, we want to focus on portfolio diversification, flexibility, and liquidity. Not only is the portfolio diversified across asset classes, sectors, and stocks, but it is also diversified across various potential economic outcomes. As the probability of tail events rises, the ability and willingness to move the portfolio quickly increases.
Our portfolio has both defensive and opportunistic characteristics. We are defensively positioned for a slowdown in developed markets, where valuations are higher, and opportunistically positioned to take advantage of a recovery in emerging markets, including China and South Africa, where valuations are more attractive. The overall macro environment, however, may continue to swing between a state of decent growth & sticky inflation and a state of labour market concerns & continued disinflation.
We remain overweight SA Equities and underweight Global Equities, in particular US equities, where valuations remain the highest, rates are high, and sign of a slowing consumer are emerging. We are more constructive on Emerging Markets and particularly China where policy makers have accelerated policy easing in response to weak economic data and Fed easing. Valuations here remain attractive.
We have a tactical underweight in SA Property after a strong performance last year. We remain underweight in Global Property. We remain overweight both SA and Global Fixed Income, which will benefit from a US economic slowdown. Local bond yields have risen again and remain attractive on a relative and absolute basis, given the outlook for lower inflation, rate cuts, fiscal consolidation and increased foreign flows into the asset class. We are overweight in Commodities, particularly gold and platinum. Gold has done well on geopolitical tensions and central bank diversification.
Notes: MSCI country indices used where no index is shown. Internal index currently consists of 45% FTSE/JSE Capped Swix, 25% MSCI AC World, 2% FTSE SA Listed Property Index, 2.5% FTSE EPRA NAREIT Developed Index, 1.5% Equal Weighted SA Commodity ETFS, 18% All Bond Index & 4% STEFI & 2% US Overnight Cash.
Topics
Disclaimer
Fairtree Asset Management (Pty) Ltd is an authorised financial services provider (FSP 25917). Collective Investment Schemes in Securities (CIS) should be considered as medium-to-long-term investments. The value may go up as well as down and past performance is not necessarily a guide to future performance.
CISs are traded at the ruling price and can engage in scrip lending and borrowing. A schedule of fees, charges and maximum commissions is available on request from the Manager. A CIS may be closed to new investors in order for it to be managed more efficiently in accordance with its mandate. Performance has been calculated using net NAV to NAV numbers with income reinvested. The performance for each period shown reflects the return for investors who have been fully invested for that period. Individual investor performance may differ as a result of initial fees, the actual investment date, the date of reinvestments and dividend withholding tax. Full performance calculations are available from the manager on request. There is no guarantee in respect of capital or returns in a portfolio. Prescient Management Company (RF) (Pty) Ltd is registered and approved under the Collective Investment Schemes Control Act (No.45 of 2002). For any additional information, such as fund prices, fees, brochures, minimum disclosure documents and application forms, please go to www.fairtree.com.
Highest rolling one-year return is 57.79% (Benchmark 30.65%) and the lowest rolling one-year return -9.29% (Benchmark:
-10.47%) (information to 31 March 2025). The fund has returned an annualised return of 11.06% since inception (January 2017) (benchmark annualised return of 7.92% since inception). The fund’s annualised performance over 1 year is 15.31% (Benchmark: 12.50%). The fund’s annualised performance over 3 years is 10.56% (Benchmark: 8.94%). Fund returns disclosed are annualised returns net of investment management fees and performance fees. Annualised return is weighted average compound growth rate over the period measured. Fund investment risk indicator level: moderately aggressive. Full performance calculations are available from the manager on request. Annualised performance shows longer term performance rescaled to a 1-year period. Annualised performance is the average return per year over the period. Actual annual figures are available to the investor on request. Highest & Lowest return: The highest and lowest returns for any 1 year over the period since inception have been shown. NAV: The net asset value represents the assets of a Fund less its liabilities. *The forecasts are based on reasonable assumptions, are not guaranteed to occur and are provided for illustrative purposes only.
This document is confidential and issued for the information of the addressee and clients of Fairtree Asset Management only. It is subject to copyright and may not be reproduced in whole or in part without the written permission of Fairtree Asset Management. The information, opinions and recommendations contained herein are and must be construed solely as statements of opinion and not statements of fact. No warranty expressed or implied, as to the accuracy, timeliness, completeness, fitness for any particular purpose of any such recommendation or information is given or made by the Manager in any form or manner whatsoever. Each recommendation or opinion must be weighed solely as one factor in any investment or other decision made by or on behalf of any user of the information contained herein, and such user must accordingly make its own study and evaluation of each strategy/security that it may consider purchasing, holding or selling and should appoint its own investment or financial or other advisers to assist the user in reaching any decision. The Manager will accept no responsibility of whatsoever nature in respect of the use of any statement, opinion, recommendation, or information contained in this document. This document is for information purposes only and does not constitute advice or a solicitation for funds.
.
Values-driven investing
Download the fund factsheet
Download the montly fund factsheet to view comprehensive information and performance data.


FAIRTREE INSIGHTS
You may also be interested in
Explore more commentaries from our thought leaders, offering in-depth analysis, market trends and expert analysis.

Wild Fig Multi Strategy Hedge Fund Q2 Investor Update
Quarter 2 headlines were driven by Trump 2.0 and his policies surrounding the US tariff trade stance, the ensuing widespread global market sell-off and the subsequent 90-day pause that triggered a sharp reversal of these losses.


Fairtree Global Flexible Income Plus Fund Q2 2025 Commentary
After the very slow start for US equities during the first quarter, and the superior performance emanating from the EU and the UK, the second quarter witnessed a turnaround in fortunes with the tech-heavy NASDAQ delivering its fourth-best quarterly performance number over the past 18 years.


Fairtree SA Equity Prescient Fund Q2 2025 Commentary
During Q2, Bonds increased by 5.9% and Cash returned 1.9%. The MSCI Emerging Market Index increased by 11.9% (in USD), outperforming the MSCI World Index, which increased by 11.4% (in USD). The MSCI South Africa Index increased by 13.6% (in USD).
We are Fairtree
Subscribe to our newsletter
Stay informed with the latest insights and updates. Subscribe to our newsletter for expert analysis, market trends, and investment strategies delivered straight to your inbox.

"*" indicates required fields

About you…
By proceeding, I confirm that:
- To the best of my knowledge, and after making all necessary inquiries, I am permitted under the laws of my country of residence to access this site and the information it contains; and
- I have read, understood, and agree to be bound by the Terms and Conditions of Use described below.
- Please beware of fraudulent Whatsapp groups pretending to be affiliated with Fairtree or Fairtree staff members.
If you do not meet these requirements, or are unsure whether you do, please click “Decline” and do not continue.