Archives: Resources
Fairtree Equity Explorer | The digital duopoly: Alphabet & Meta in the global ad market | Episode 5


Transcript
Topics
FAIRTREE INSIGHTS
You may also be interested in
Explore more commentaries from our thought leaders, offering in-depth analysis, market trends and expert analysis.


Macro Pulse Episode 20
In this episode, Jacobus discusses major events leading up to year-end, recent US court cases, and the rise in long bond yields.


Fairtree Market Insights with Karena Naidu | Episode 7: Part 2
Market Insights, an exciting video series where Karena Naidu, Global Investment Specialist, delves into key insights in global equity markets with Equity Portfolio Managers Cornelius Zeeman and Jacques Haasbroek.

Fairtree Market Insights with Karena Naidu | Episode 7: Part 1
Market Insights, an exciting video series where Karena Naidu, Global Investment Specialist, delves into key insights in global equity markets with Equity Portfolio Managers Cornelius Zeeman and Jacques Haasbroek.
Macro Pulse Episode 16

Transcript
Topics
FAIRTREE INSIGHTS
You may also be interested in
Explore more commentaries from our thought leaders, offering in-depth analysis, market trends and expert analysis.
Macro Pulse Episode 20
In this episode, Jacobus discusses major events leading up to year-end, recent US court cases, and the rise in long bond yields.
Fairtree Market Insights with Karena Naidu | Episode 7: Part 2
Market Insights, an exciting video series where Karena Naidu, Global Investment Specialist, delves into key insights in global equity markets with Equity Portfolio Managers Cornelius Zeeman and Jacques Haasbroek.
Fairtree Market Insights with Karena Naidu | Episode 7: Part 1
Market Insights, an exciting video series where Karena Naidu, Global Investment Specialist, delves into key insights in global equity markets with Equity Portfolio Managers Cornelius Zeeman and Jacques Haasbroek.
Bloemhof Fairtree U16 Hockey Tournament

Transcript
Topics
FAIRTREE INSIGHTS
You may also be interested in
Explore more commentaries from our thought leaders, offering in-depth analysis, market trends and expert analysis.


Leo Matthysen | Proud Partner
For years, Fairtree has supported Leo Matthysen on his tennis journey – from an eight-year-old with a racket and a dream in Mitchell’s Plain to a current South African Davis Cup player.
Macro Pulse Episode 15

Transcript
Topics
FAIRTREE INSIGHTS
You may also be interested in
Explore more commentaries from our thought leaders, offering in-depth analysis, market trends and expert analysis.
Macro Pulse Episode 20
In this episode, Jacobus discusses major events leading up to year-end, recent US court cases, and the rise in long bond yields.
Fairtree Market Insights with Karena Naidu | Episode 7: Part 2
Market Insights, an exciting video series where Karena Naidu, Global Investment Specialist, delves into key insights in global equity markets with Equity Portfolio Managers Cornelius Zeeman and Jacques Haasbroek.
Fairtree Market Insights with Karena Naidu | Episode 7: Part 1
Market Insights, an exciting video series where Karena Naidu, Global Investment Specialist, delves into key insights in global equity markets with Equity Portfolio Managers Cornelius Zeeman and Jacques Haasbroek.

Third time lucky | South Africa’s 2025 Budget
By Jacobus Lacock, Multi-Asset Portfolio Manager & Macro Strategist, and Sevashen Thaver, Multi-Asset Analyst
South Africa’s new Government of National Unity (GNU) finally passed its first Budget after Finance Minister Enoch Godongwana’s third attempt. Overall, the Budget has been welcomed by bond and equity investors. Faced with the twin challenges of aligning lower government revenues with vital spending priorities and safeguarding fiscal stability, the Minister largely succeeded in striking the necessary balance.
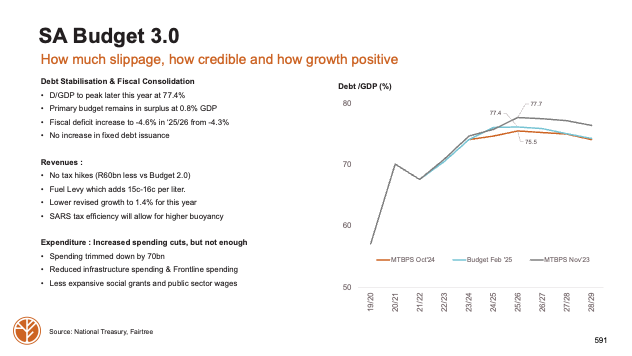
On the revenue side, the Budget projects roughly R60 billion less revenue over the medium term compared with the previous fiscal plan. This decline reflects the scrapping of the planned VAT increase and a downward revision of the 2025 GDP growth forecast to 1.4% (down from 1.9% in March). Despite this setback, the anticipated revenue gap was more than offset by targeted cuts to expenditure. Relative to the prior Budget, total spending is trimmed by R70 billion, with reductions across frontline services, infrastructure projects, social grants, and public sector staff costs. Yet total outlays remain R224 billion higher than twelve months ago, a clear signal that the GNU remains committed to supporting growth through public investment.
Complementing these measures is a series of tax and revenue initiatives designed to shore up the fiscal position without unduly burdening households. The fuel levy will now be indexed annually to inflation, adding approximately 15-16 cents per litre, while personal income-tax brackets will remain static. The Budget also assumes an additional R20 billion in tax revenue next year, contingent on SARS enhancing its collection efficiency, a goal that National Treasury estimates could yield between R20 billion and R50 billion annually. Furthermore, the government is committing to perform a comprehensive redesign of the Budget process. The implementation of spending-review recommendations is expected to generate R38 billion in savings. These potential savings have not been accounted for in the Budget.
Fiscal consolidation continues to be a cornerstone of this Budget. The debt-to-GDP ratio is projected to peak at 77.4% this year, slightly higher than earlier drafts but falling thereafter, while the primary budget balance stays in surplus, at 0.8% of GDP, rising to 2.1% over the medium term. Crucially, the government has not increased its issuance of fixed-rate bonds, signalling no further expansion of gross debt.
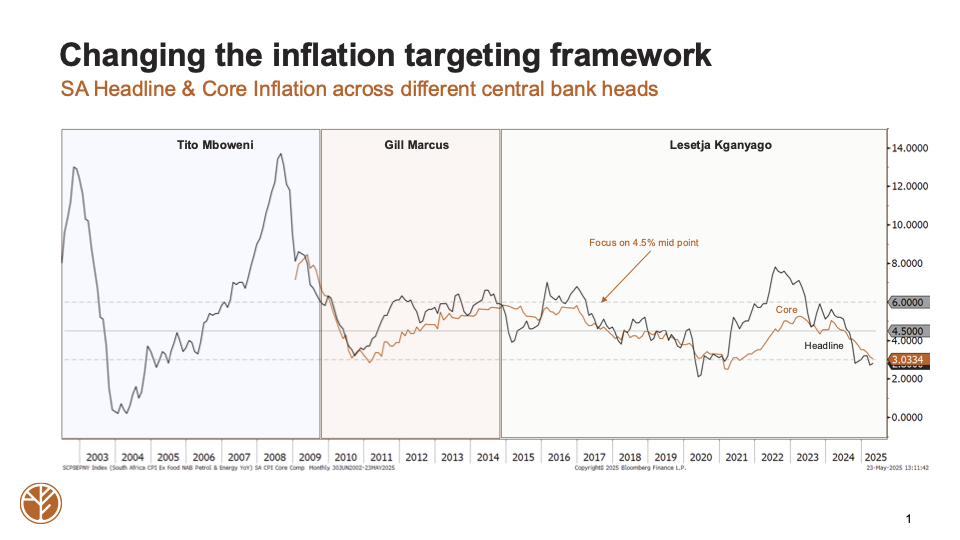
One notable omission from the Budget was an official announcement of a revised inflation-targeting framework. Both the South African Reserve Bank (SARB) and National Treasury agree that the current 3%–6% band is too broad and high relative to emerging-market peers. Though technical teams are finalising recommendations, markets are already optimistic that a lower target will be phased in over several years, mirroring Brazil’s gradual shift from 4.5% in 2018 to 3.0% in 2024. A lower inflation target will reset and anchor inflation expectations lower, which promises enhanced competitiveness through reduced input costs, lower borrowing rates that bolster investment, and lower government interest costs. Potential negative trade-offs may come from lower nominal growth, government revenues and corporate earnings.
Recent inflation data bolster the case to reset the inflation target at the current juncture: headline inflation stood at 2.8% for the second consecutive month below the 3% lower band, while core inflation surprised to the downside at 3.0%. With inflation likely to average well under 3.5% in 2025, we expect the SARB to revise its forecasts downward at the end of month meeting and to announce 25 basis-point rate cuts at each of the next two gatherings.
Externally, the South African rand and Emerging Market assets have remained resilient, supported by a softer US dollar, lower oil prices, and the freedom for emerging markets to ease policy in the absence of overheating. However, geopolitical dynamics, particularly South Africa’s relationship with the United States, pose risks. That said, recent high-level talks in Washington yielded positive commitments on trade, potentially averting a tariff escalation from 10% to 31% on 9 July. Proposals on the table include tariff reductions on US imports, increased LNG procurement, critical-minerals exploration, revised BEE regulations for international companies, and expanded access for Starlink and Tesla, though AGOA’s future remains uncertain. Domestically, the high levels of crime may weigh on investor sentiment.
In sum, this Budget deftly navigates reduced revenues through prudent spending cuts while preserving some growth-enhancing investments. With fiscal consolidation on track, inflation firmly under control, and a resilient currency, South Africa exits this Budget cycle with cautious optimism, provided it continues to manage both internal and external headwinds effectively.
Topics
We are Fairtree
Subscribe to our newsletter
Stay informed with the latest insights and updates. Subscribe to our newsletter for expert analysis, market trends, and investment strategies delivered straight to your inbox.

"*" indicates required fields

FAIRTREE INSIGHTS
You may also be interested in
Explore more commentaries from our thought leaders, offering in-depth analysis, market trends and expert analysis.
Macro Pulse Episode 20
In this episode, Jacobus discusses major events leading up to year-end, recent US court cases, and the rise in long bond yields.
Fairtree Market Insights with Karena Naidu | Episode 7: Part 2
Market Insights, an exciting video series where Karena Naidu, Global Investment Specialist, delves into key insights in global equity markets with Equity Portfolio Managers Cornelius Zeeman and Jacques Haasbroek.
Fairtree Market Insights with Karena Naidu | Episode 7: Part 1
Market Insights, an exciting video series where Karena Naidu, Global Investment Specialist, delves into key insights in global equity markets with Equity Portfolio Managers Cornelius Zeeman and Jacques Haasbroek.
Disclaimer
Fairtree Asset Management (Pty) Ltd is an authorised financial services provider (FSP 25917). Collective Investment Schemes in Securities (CIS) should be considered as medium to long-term investments.
Disclaimer
Fairtree Asset Management (Pty) Ltd is an authorised financial services provider (FSP 25917). Collective Investment Schemes in Securities (CIS) should be considered as medium to long-term investments.

Fairtree BCI Income Plus Fund Q1 2025 Commentary
Market dynamics
Global Risk
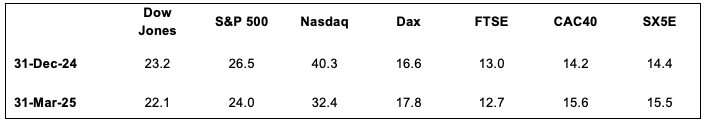
It was a complete turnaround in the fortunes of global equities in the first quarter of 2025. The 47th US President was sworn in during the period, and contrary to popular opinions, the US stock market took a bit of a beating from a relative perspective. The Large Cap Dow Jones Industrial Average lost some 0.87% whilst the tech-heavy NASDAQ lost some 10.26% over the period. Several reasons have come through for this, but more than anything else, it was an excuse the market needed to bring the North American equity indices a little lower in price. One must sometimes remember that the PE ratio of the NASDAQ as at the end of December 2024 was at 40.25 and has derated to 32.4. When one considers that the best performer over the period was the Dax, which delivered over 11%, most of this outperformance was due to a re-rating of its PE, which increased from 16.6 to 17.8 times. This amounted to around 7% in total return, the additional four or so percent coming through from increased earnings. The de-rating of the NASDAQ would have subtracted some 19.5% of return, so obviously the differential has come through increased earnings from that index. All very poignant when one considers what can happen if PE ratios normalise from a global perspective. Table 1 below shows the PE ratios of the major equity indices as at the end of Q4 2024 and Q1 2025.
Table 1: Major Index Price Earnings Ratios Q4 2024 – Q1 2025
Source: Bloomberg, 31 March 2025
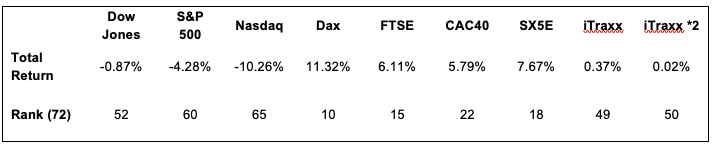
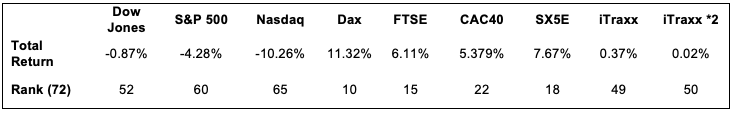
Moving to European credit, the iTraxx suite of indices produced another set of numbers that were marginally in the black. The iTraxx Crossover 5-year Total Return Index produced a meagre 0.37%, which underperformed cash at the margin, whilst the 2 times levered index, our more favoured measure of the relative performance of European credit, produced a rounding error from zero at 0.02% for the quarter. These were not particularly great from a historical point of view. Yes, they did remain positive, but only just. From a persistence perspective, one must return to the 2nd quarter of 2022 to find a negative total return from the iTraxx Crossover. For the first time since Q1 2024, the DAX, the FTSE 100, the SX5E and the CAC 40 outperformed the iTraxx Crossover in total return terms. In fact, of the last 72 quarters, only 22 of those quarters have witnessed European equities outperforming the credit index. When one looks at more of a like-for-like in risk terms by using the 2x levered XOver, that number drops to 14. Just to reiterate what this means, in the last 18 years of quarterly data, European equities have only outperformed the 2 times levered iTraxx XOver index on 14 occasions.
Table 2: Major Index Q4 2024 Total Return and historic rankings Q2 2007 – Q1 2025
Source: Bloomberg, 31 March 2025.
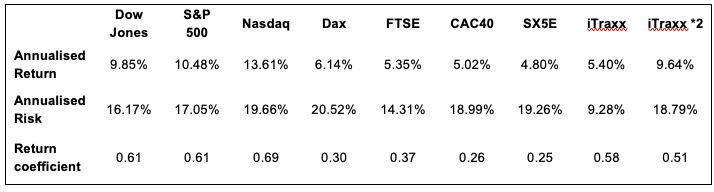
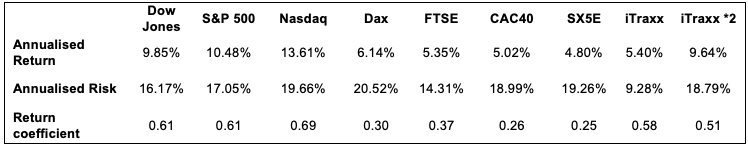
Given that we have 18 years of quarterly data, we can do more than just look at the outright performance numbers and the relative rankings. We can also look at relative risk measures such as standard deviations, Sharpe Ratios, and other measures of risk-adjusted returns. Obviously, this should be important to investors who do “feel” risk in the diffusion of the performance that they have been delivered. For the same absolute return in a portfolio, only a fool would be happy with more risk for that return than less risk. There are many definitions of what risk is, and what is important for one investor is quite different from another, but we feel that the most consistent and comparable is the time-tested standard deviation, which has its roots in its underlying mathematical construct. This makes it consistent in its treatment of any distribution of potential outcomes. The simple calculation of mean divided by standard deviation gives a good measure of risk-adjusted return, which we tend to like to look at. This is not the Sharpe Ratio (SR), as the SR strips out risk-free return as well as the volatility of that risk-free return, but we feel that the basic return per unit risk ratio is a good proxy for the slightly more rigorous SR. Obviously, a higher number is better as the investor receives more return for their accumulated risk. We must be aware, however, that a high number on its own cannot be viewed as the “Holy Grail’ since any low volatility index might deliver high levels of Return Coefficient but might not deliver that much by way of return. For example, it might be foolish to buy an index that produces 0.4% annual return with 0.2% annualised volatility – a return coefficient of 2, rather than an index that produces 12% return with a standard deviation of 8%.
Table 3 shows the annualised returns, the annualised risk, and the return coefficients for the major indices we monitor. These numbers are generated from our historic dataset and therefore do include risk periods such as the Global Financial Crisis (GFC), the Greek Government default crisis, the COVID 19 global pandemic, the more recent Ukraine/Russian War as well as the current war in the Middle East and all the political turmoil in Europe the UK and the United States. Perhaps it is more of the same rather than the exception now, with the world as usual teetering on the brink of the potential for some financial fallout. Still, traditionalists would suggest that this potential for fallout is the very reason that risk premia exist in the first place. No risk should have risk-free returns; those who choose to take the risk of loss should surely be rewarded for doing so. This line of argument would go a long way in explaining persistence in market returns, the “overvaluation” of US equities has been bandied around for the last 2 decades, and yet they continue to outperform their European counterparts. Contrary to popular opinion, the outperformance will more than likely continue until participants accept it as the “new normal”, and when that eventually happens, it will probably be followed by a reversal of fortunes. The relative performance of Europe over the 1st quarter of 2025 is a moot point, but one will need to see a lot more persistence of this to conclude about the “dawning of a new era”. Perhaps, as is always the case in statistics, they perfectly explain the past but say absolutely nothing about the future. In accepting this, one realises that solid views still need to be taken to profit from any market dislocation or relocation. Time will be a fantastic teacher in this regard.
From a European perspective, Table 3 highlights the outperformance of credit from a risk-adjusted perspective. In fact, the more risk normalised two times levered index solidly outperforms its equity equivalent, offering investors excess return for a given risk target. If investors are comfortable with equity-type risk, they should be more than happy with the extra return that iTraxx*2 has offered. This index goes a long way to close the relative gap to US equities, that gap has closed somewhat during Q1, and provides a rather good fund diversifier to the allocator that has a US strategic overweight.
Table 3: Index Risk Adjusted Return Coefficient
Source: Bloomberg, 31 March 2025
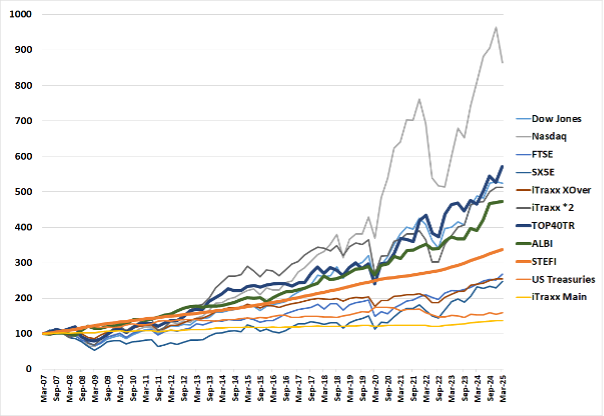
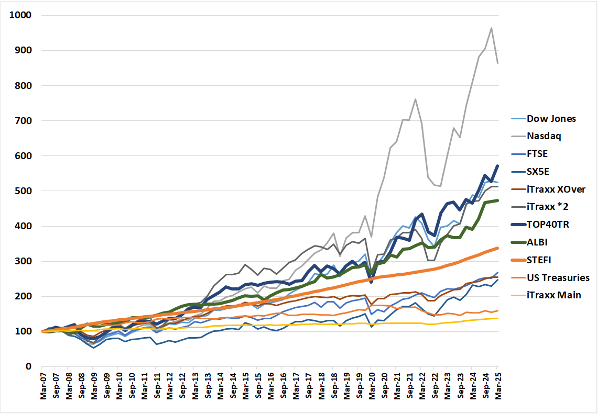
As an extension of last quarter’s report, Figure 1 below shows the cumulative return of the various indices in the currency of the index domicile. The various performance traces were indexed to 100 at the beginning of the second quarter of 2007, when we had complete historic data for the iTraxx XOver and Main total returns.
Figure 1 also shows that there are no returns to risk-free. The worst-performing traces over the past 18 years are the iTraxx Main Index (125 equally weighted global investment-grade credit names) and the US Treasuries total return index. Looking at the delivered risk, it becomes apparent that US Treasuries are not the least risky asset class but rather the well-diversified investment-grade CDS index—iTraxx Main. They have generated the lowest returns coupled with the lowest associated risk over the past 18 years.
Figure 1: Major Index Total Return Q2 2007 – Q1 2025
Source: Bloomberg, 31 March 2025.
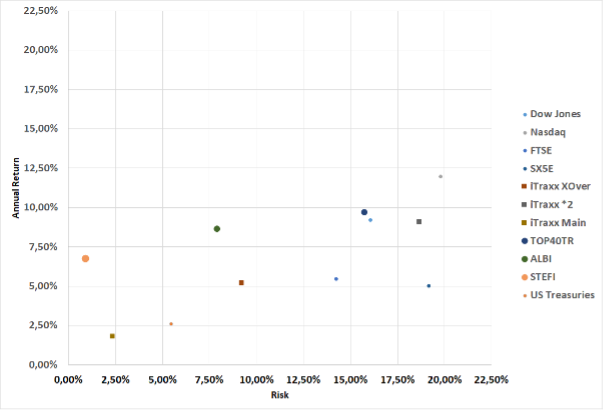
It is difficult to look at the returns and the associated volatility of those returns simultaneously in Figure 1. To disentangle the graphic and the more meaningful comparatives, we produce the delivered risk (as computed by the annualised standard deviation of quarterly returns) and the delivered annualised return over the 18 years. This is shown in Figure 2. If we fit a straight line to this dataset, we would observe an upward slope indicating a positive return to risk. Increase that risk, and it should result in a higher delivered return. The corollary of this is also apparent: a reduction in risk taken will result in a reduced overall delivered return. The textbooks, which have always stated that there needs to be an excess return to risk are indeed correct. The short run is deemed to be random, whilst the longer run will yield excess return due to the extraction of the various risk premia. As time elapses, the risk premium (or positive slope) becomes more apparent. One heuristic would be that the short run is randomly distributed around a mean and variance, whereas the longer run is an equally weighted “portfolio” of those independent periods. Thanks to the only free lunch in finance, i.e. the Central Limit Theorem, the long run results in a normally distributed outcome centring on that delivered risk premium. Mathematics delivers to investors what economists can only posit.
Figure 2: Major Index Risk Return scatterplot Q2 2007 – Q1 2025Source: Bloomberg, 31 March 2025.

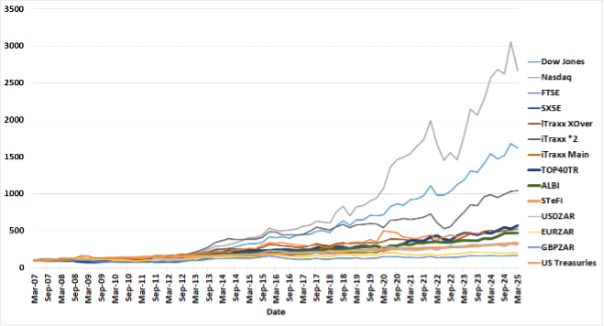
The domination in return terms of US equities, which was touched on earlier in this piece, is quite apparent in the figure, but one must be cognizant that these indices are shown in local currency. This explains the relatively good performance of the South African Top40 Total Return index based on the Rand. To do a proper comparative study, we need to translate all the indices into a common currency, and then the comparison becomes more meaningful.
Figure 3 shows the index returns in ZAR, which again shows the domination of US equities over their European counterparts. The long-term outperformance of US risk assets translated into ZAR obviously validates questions regarding asset allocators’ offshore exposures.
Figure 3: Major Index Total Return in ZAR Q2 2007 – Q1 2025
Source: Bloomberg, 31 March 2025.
Moving to the economic backdrop, Figure 4 shows inflation in the developed world (US, UK, Eurozone and South Africa), highlighting that inflation is well off its highs hit in the 4th quarter of 2022. The fact that the disinflationary trend, which started in the US, seems to have slowed down and has resulted in a more cautious response from the central banks. What is interesting to note is that the convergence of South African headline inflation to the developed nations might have indicated that there is some extra room for the SARB to consider more aggressive cuts, certainly from a relative perspective. To date, the SARB has been overly cautious and missed the opportunity to cut rates more aggressively. We believe that the window of opportunity may have closed already, with inflation picking back up to around 3.2% from a low of 2.8%. It would be difficult for the governor to cut rates now that inflation is rising, and perhaps with the backdrop of increased VAT, with its spillover into inflation numbers, it will be even more difficult for the MPC to continue with the cutting cycle. The other issue is that the ZAR has weakened dramatically over the short run and given the fact that around 605 of the inflation baskets is ZAR related, the prospect for higher inflation looms in 2025. To add further headwind, there is the talk of reducing the inflation target band itself, which will require higher real rates for South Africa to transition to a lower band. All these factors have resulted in the change of our central case from further cuts to no cuts.
Figure 4: Annual change in Consumer Price Indices March 2010 – March 2025
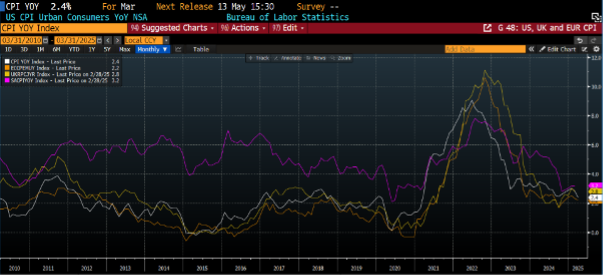
Source: Bloomberg, 31 March 2025
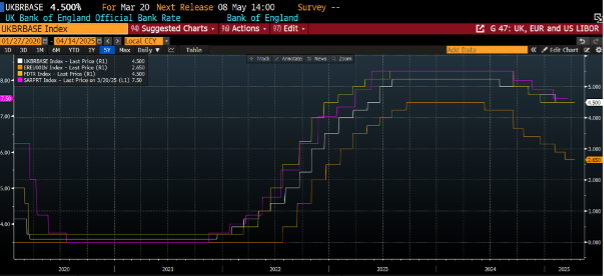
Figure 5 below shows the short rates administered by the US Federal Reserve, the European Central Bank, the Bank of England and the South African Reserve Bank. What is of interest to note is the high levels of correlation in both the direction and the extent of policy movements. The other point to highlight is that the response from the SARB has been the most restrained in terms of timing and extent. The Fed has cut by 100 bps, the ECB 185 bps, the BOE 75 bps and the SARB 75 bps, albeit off a much higher base. As was previously stated, we will now contend that the window for further rate cuts has now closed, but remain cognisant of the current environment where the market is discounting some 100-125 bps of cuts by the Fed by Q1 2026. However, we believe that those excesses will be taken out of market prices over the next quarter, as the “Tariff War” premium unwinds.
Figure 5: Central Bank Administered Rates
Source: Bloomberg, 31 March 2025
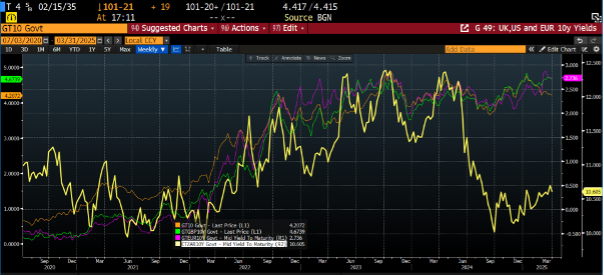
The movements in global bond yields are shown in Figure 5. The 10-year US Treasury, the UK Gilt, the benchmark European Bund, and the 10-year South African Government 10-year Bond are shown in the Figure, albeit using three different scales. It is interesting to point out the high levels of correlation between these four traces, and that although short-term disconnects tend to take place, they generally are swiftly reversed. Bearing this in mind, one can see that the current yield on the generic 10-year SA bond is probably unsustainable. It does not take much by the way of imagination to see that the bond is currently trading at too low a yield from a relative perspective, and local bulls should be aware that the more short term outperformance of the local asset class is not based on global fundamentals, and that those relative valuations will be the determining factor of where yields find their equilibrium level. Of course, it does take all types to make a market, and the current price is real, we should therefore be cautious have having too strong a view on such matters as “betting the farm” on one’s views on current valuations is never a great strategy, but small tactical overweight /underweights must be based on something.
Figure 6: 10-year benchmark yields in the US, UK and SA
Source: Bloomberg, 31 March 2025
Fund Performance
The fund’s strategy is to provide investors access to a well-diversified credit portfolio that aims to outperform its targeted return of STeFI+3% over the long term, within an annualised risk target of less than 3%, as measured by the annualised standard deviation of monthly returns. This, ex ante, implies a Sharpe ratio of 1.
Table 4 shows the total performance of the Fairtree BCI Income Plus Fund relative to STeFI, the All-Bond Index (ALBI), and the Top40 Total Return Index over various historical periods. The total returns vary from 1 month to 10 years, arguably showing the short, medium, and long run performance numbers. One should note that the indices carry no fees, while the fund performance is in accordance with Class A, which has a TER of 0.90% per annum, as reported by Bloomberg. When one observes the table, it is pretty apparent that the Fairtree BCI Income Plus Fund has delivered very stable annualised performance numbers across all time periods, both from an absolute as well as a relative basis.
Table 4: Fairtree BCI Income Plus Fund historic annualised total returns to end Q1 2025
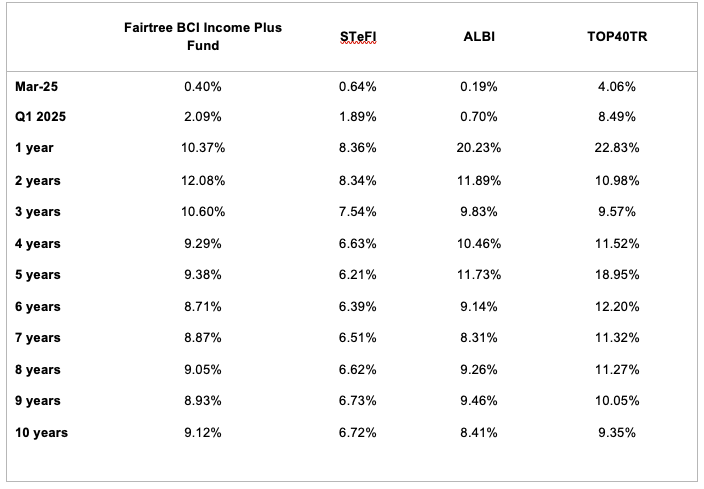
Source: Bloomberg, 31 March 2025
When analysing the table, a few things become quite apparent, and even a touch startling.
- The fund had a rather pedestrian first quarter of 2025, generating 2.09% on an outright basis whilst outperforming STeFI by 0.20% on an after-all-fees basis. This was below our expectations of 2.35% for the quarter.
- The fund has delivered more than 3.17% per annum above STeFI over the past 5 years and more than 2.01% excess return per annum over all measurement periods.
- Despite its defensive positioning, the fund has outperformed STeFI by around 2.01% on the most recent rolling 1-year basis.
- The fund exceeded its target over the last two years, delivering over 4% excess return to STeFI per annum and outperforming both the ALBI and the TOP40 Total Return Index.
Looking to the 2nd quarter of 2025, the weakness in global credit markets has allowed us to increase the fund’s risk, and the spread to 3-month JIBAR has increased to some 260 bps. With the 3-month JIBAR having reduced to 7.55%, the current yield of the fund is around 10.15% on a pre-fees basis. Subtracting the TER of 0.90% results in a pro forma 12-month outlook of around 9.5%. This, of course, is our central case, and there is a distribution around this number. Of course, the fund will be affected by the trials and tribulations of global credit markets. Still, given the fact that the fund is currently defensively positioned, the managers will continue to nibble high-yielding assets into any weakness.
Looking a bit further out, 1-year swaps closed the quarter almost unchanged from the previous quarter at 7.40%, so prospectively the fund should deliver just under 10% on a pre-fees basis, and around 9.4% on a post-fees basis. Regarding rate cuts, our central case is that the current global market volatility will subside, and that the SARB will continue to show reluctance to cut rates further, the window of opportunity has probably been missed and that it will be difficult for the MPC to cut rates into an increasing inflation backdrop. We therefore expect that, barring some global calamity, the next major move in interest rates will be higher. Our previous view was constructive on short-term rates, but we now feel that the more recent narrative coming from the Reserve Bank Governor regarding the lowering of the inflation target will require higher real rates in the short run, again reinforcing the argument for stable rather than lower rates. We can only go on the word of the Governor, obviously if they re-institute the cutting cycle, cutting by a further 75 bps or so, bonds will perform well whilst the fund yield will drop on a 1 for one basis. This remains our risk case from an outright and relative basis. We continue to stay true to our mandate, avoiding the temptation to start increasing the interest rate duration of the fund, as this is outside the scope of what we usually do and would be incongruent with our expected investment thesis.
Looking to the second quarter, the markets will be jostling with the potential of continued global political instability. The backdrop remains fluid, with managers facing the conundrum of increasing portfolio risk in an ever-increasing risky backdrop. For those who have the capacity to take on more risk, this may prove to be a wonderful opportunity. Still, unfortunately, as is normally the case, most managers were already fully invested in the sell-off and do not have the means or the appetite to buy into further weakness. Luckily, due to our disciplined approach to beta exposure, we have ample liquidity in the fund, which will be deployed as the opportunities present themselves. The portfolio will be reshaped in any prolonged or temporary bear market
Topics
Disclaimer
The highest calendar year return was 13.06%, and the lowest calendar year return was 5.58% (information as of 31 March 2025). The fund has returned an annualised return of 9.03% since inception (12 March 2014) (Benchmark return: 8.27% since inception).
Disclaimer
The highest calendar year return was 13.06%, and the lowest calendar year return was 5.58% (information as of 31 March 2025). The fund has returned an annualised return of 9.03% since inception (12 March 2014) (Benchmark return: 8.27% since inception).

Fairtree Global Flexible Income Plus Fund Q1 2025 Commentary
Market dynamics
Global risk
It was a complete turnaround in the fortunes of global equities in the first quarter of 2025. The 47th US President was sworn in during the period, and contrary to popular opinions, the US stock market took a bit of a beating from a relative perspective. The Large Cap Dow Jones Industrial Average lost some 0.87% whilst the tech-heavy NASDAQ lost some 10.26% over the period. Several reasons have come through for this, but perhaps more than anything else, it was an excuse the market needed to bring the North American equity indices a little lower in price. One must sometimes remember that the PE ratio of the NASDAQ as at the end of December 2024 was at 40.25 and has derated to 32.4. When one considers that the best performer over the period was the Dax, which delivered over 11%, most of this outperformance was due to a re-rating of its PE, which increased from 16.6 to 17.8 times. This amounted to around 7% in total return, the additional four percent coming from increased earnings. The de-rating of the NASDAQ would have subtracted some 19.5% of return, so obviously the differential has come through increased earnings from that index. All very poignant when one considers what can actually happen if PE ratios normalise from a global perspective. Table 1 below shows the PE ratios of the major equity indices at the end of Q4 2024 and Q1 2025.
Table 1: Major Index Price Earnings Ratios Q4 2024 – Q1 2025
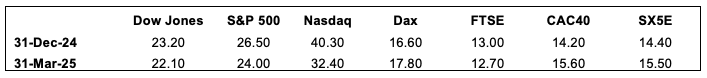
Source: Bloomberg, 31 March 2025
Moving to European credit, the iTraxx suite of indices produced another set of numbers that were marginally in the black. The iTraxx Crossover 5-year Total Return Index produced a rather meagre 0.37%, which underperformed cash at the margin, whilst the 2 times levered index, our more favoured measure of the relative performance of European credit, produced a rounding error from zero at 0.02% for the quarter. These were not particularly great from a historical point of view. Yes, they did remain positive, but only just. From a persistence perspective, one must return to the 2nd quarter of 2022 to find a negative total return from the iTraxx Crossover. For the first time since Q1 2024, the DAX, the FTSE 100, the SX5E and the CAC 40 all outperformed the iTraxx Crossover in total return terms. In fact, of the last 72 quarters, only 22 of those quarters have witnessed European equities outperforming the credit index. When one looks at more of a like-for-like in risk terms by using the 2x levered XOver, that number drops to 14. To reiterate what this means, in the last 18 years of quarterly data, European equities have only outperformed the 2 times levered iTraxx XOver index on 14 occasions.
Table 2: Major Index Q4 2024 Total Return and historic rankings Q2 2007 – Q1 2025
Source: Bloomberg, 31 March 2025
Given that we have 18 years of quarterly data, we can do more than just look at the outright performance numbers and the relative rankings. We can also look at relative risk measures such as standard deviations, Sharpe Ratios, and other measures of risk-adjusted returns. This should be important to investors who do “feel” risk in the diffusion of the performance that they have been delivered. For the same absolute return in a portfolio, only a fool would be happy with more risk for that return than less risk. There are many definitions of what risk is, and what is essential for one investor is quite different from another. Still, we feel that the most consistent and comparable is the time-tested standard deviation, which has its roots in its underlying mathematical construct. This makes it consistent in treating any distribution of potential outcomes. The simple calculation of mean divided by standard deviation gives a good measure of risk-adjusted return and is one that we tend to like to look at. This is not the Sharpe Ratio (SR), as the SR strips out risk-free return as well as the volatility of that risk-free return, but we feel that the basic return per unit risk ratio is a good proxy for the slightly more rigorous SR. A higher number is better as the investor receives more return for accumulated risk. We must be aware, however, that a high number on its own cannot be viewed as the “Holy Grail’ since any low volatility index might deliver high levels of Return Coefficient but might not deliver that much by way of return. By way of an example, it might be foolish to buy an index that produces 0.4% annual return with 0.2% annualised volatility – a return coefficient of 2, rather than an index that produces 12% return with a standard deviation of 8%.
Table 3 shows the annualised returns, the annualised risk, and the return coefficients for the major indices we monitor. These numbers are generated from our historic dataset and therefore do include risk periods such as the Global Financial Crisis (GFC), the Greek Government default crisis, the COVID 19 global pandemic, the more recent Ukraine/Russian War as well as the current war in the Middle East and all the political turmoil in Europe the UK and the United States. Perhaps it is more of the same rather than the exception at the moment, with the world as usual teetering on the brink of the potential for some financial fallout. Still, the traditionalist would suggest that this potential for fallout is the very reason that risk premia exist in the first place. No risk should have risk-free returns; those who choose to take the risk of loss should surely be rewarded. This line of argument would go a long way in explaining persistence in market returns, the “overvaluation” of US equities has been bandied around for the last 2 decades, and yet they continue to outperform their European counterparts. Contrary to popular opinion, the outperformance will more than likely continue until participants accept it as the “new normal”, and when that eventually happens, it will probably be followed by a reversal of fortunes. The relative performance of Europe over the 1st quarter of 2025 is a moot point, but one will need to see a lot more persistence of this to conclude about the “dawning of a new era”. Perhaps, as is always the case in statistics, they perfectly explain the past but say nothing about the future. In accepting this, one realises that solid views still need to be taken to profit from any market dislocation or relocation. Time will be a fantastic teacher in this regard.
From a European perspective, Table 3 highlights the outperformance of credit from a risk-adjusted perspective. The more risk normalised two times levered index solidly outperforms its equity equivalent, offering investors excess return for a given risk target. If investors are comfortable with equity-type risk, they should be more than happy with the extra return that iTraxx*2 has offered. This index goes a long way to close the relative gap to US equities, that gap has closed somewhat during Q1, and provides a rather good fund diversifier to the allocator that has a US strategic overweight.
Table 3: Major Index Price Earnings Ratios Q4 2024 – Q1 2025
Source: Bloomberg, 31 March 2025
As an extension of last quarter’s report, Figure 1 below shows the cumulative return of the various indices in the currency of the particular index domicile. The different performance traces were indexed to 100 at the beginning of the second quarter of 2007, when we had the complete historical data for the iTraxx XOver and the main total returns.
Figure 1 also shows that there are no returns to risk-free. The worst-performing traces over the past 18 years are the iTraxx Main Index (125 equally weighted global investment-grade credit names) and the US Treasuries total return index. Looking at the delivered risk, it becomes apparent that US Treasuries are not the least risky asset class but rather the well-diversified investment-grade CDS index—iTraxx Main. They have generated the lowest returns coupled with the lowest associated risk over the past 18 years.
Figure 1: Major Index Total Return Q2 2007 – Q1 2025
Source: Bloomberg, 31 March 2025
It is difficult to look at the returns and the associated volatility of those returns simultaneously in Figure 1. To disentangle the graphic and the more meaningful comparatives, we produce the delivered risk (as computed by the annualised standard deviation of quarterly returns) and the delivered annualised return over the 18 years. This is shown in Figure 2. If we fit a straight line to this dataset, we would observe an upward slope indicating a positive return to risk. Increase that risk, and it should result in a higher delivered return. The corollary of this is also apparent: a reduction in risk taken will result in a reduced overall delivered return. The textbooks, which have always stated that there needs to be an excess return to risk are indeed correct. The short run is deemed to be random, whilst the more extended run will yield excess return due to the extraction of the various risk premia. As time elapses, the risk premium (or positive slope) becomes more apparent. One heuristic would be that the short run is randomly distributed around a mean and variance, whereas the longer run is an equally weighted “portfolio” of those independent periods. Thanks to the only free lunch in finance, the Central Limit Theorem, the long run results in a normally distributed outcome centred on that delivered risk premium. Mathematics delivers to investors what economists can only posit.
Figure 2: Major Index Risk Return scatterplot Q2 2007 – Q1 2025
Source: Bloomberg, 31 March 2025
The domination in return terms of US equities, which was touched on earlier in this piece, is quite apparent in the figure, but one must be cognizant that these indices are shown in local currency. This explains the relatively good performance of the South African Top40 Total Return index, which is based on the Rand. To do a proper comparative study, we need to translate all the indices.
Moving to the economic backdrop, Figure 4 shows inflation in the developed world (US, UK, Eurozone and South Africa), highlighting that inflation is well off its highs in the 4th quarter of 2022. The fact that the disinflationary trend, which started in the US, seems to have slowed down and has resulted in a more cautious response from the central banks. What is interesting to note is the convergence of global headline inflation numbers, irrespective of the economic backdrop. One could argue that the idiosyncratic, or country-specific, inflation is less important than the dominant driver of global inflation. This is not out of phase with what we generally witness in equity markets, where global trends are the major driver of the fortunes of local markets, rather than the economic or political leanings of that country.
Figure 3: Annual Change in Consumer Price Indices March 2010 – March 2025
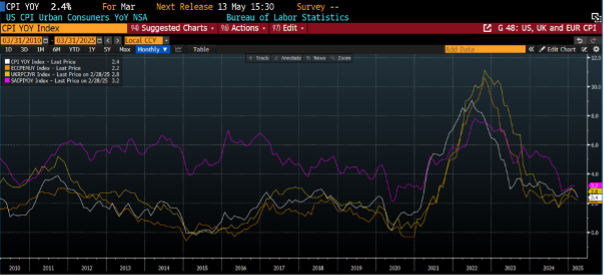
Source: Bloomberg, 31 March 2025
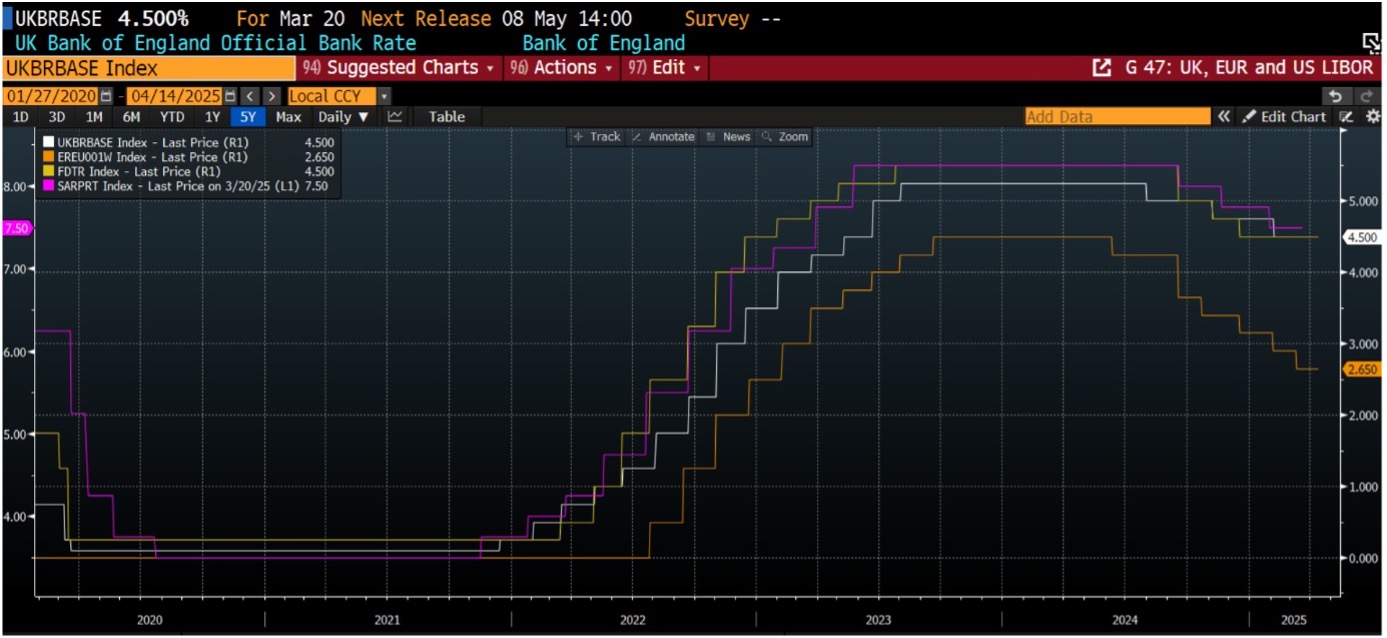
Figure 4 below shows the level of short rates as administered by the US Federal Reserve (Fed), the European Central Bank (ECB), the Bank of England (BoE) and the South African Reserve Bank (SARB). What is of interest to note is the high levels of correlation in both the direction and the extent of policy movement. The other point to highlight is that the response from the ECB has been the most aggressive in terms of timing and extent. The Fed has cut by 100 bps, the BOE 75 bps, the SARB also 75 bps, whilst the ECB has cut by 185 bps and looks to continue with the cutting cycle into Q2.
We do believe that the current uncertain backdrop, where the market is discounting some 100-125 bps of cuts by the Fed by Q1 2026, could extend the cutting cycle of the ECB but we do believe it might be time to pause for some reflection, awaiting the economic data to catch up before venturing into some further aggressive cuts from the ECB. Caution would most probably be warranted now. We do, however, believe that the current cutting excesses will be taken out of market prices over the next quarter, as the “Tariff War” premium unwinds.
Figure 4: Central Bank Administered Rates
Source: Bloomberg, 31 March 2025
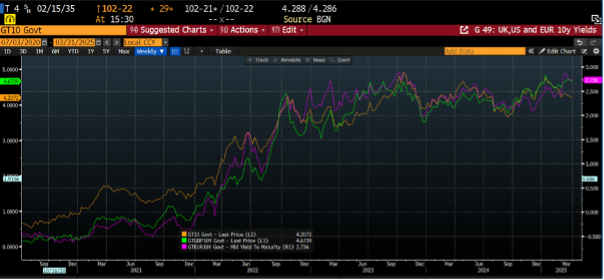
Figure 5 shows the movements in global bond yields. The 10-year US Treasury, the UK Gilt, and the benchmark European Bund are shown in the Figure, albeit using different scales. It is interesting to point out the high levels of correlation between these three traces, and that although short-term disconnects tend to occur, they generally are swiftly reversed.
As is the case with global inflation, the global cost of capital sets trends throughout the major economies, and any disconnect between yields is quickly reversed, and yields are brought back into congruence. Unfortunately for those who deem stock picking to be a long-term value-adding proposition, we would posit that the major driver of performance in a bond fund is beta rather than alpha due to stock selection. In fact, the real driver of the performance of a fixed income fund is the relative duration of that fund in comparison to the appropriate benchmark. The correlation between the different points on the yield curve is just too high to facilitate a stock picking process. It is possible, but the alpha production is so small that most of that alpha is expended in trading costs.
Figure 5: 10-year benchmark yields in the US,UK and EU
Source: Bloomberg, 31 March 2025
Fund performance
The strategy of the fund is to provide investors access to a well-diversified credit portfolio that aims to outperform its benchmark over the long term, with a lower-than-benchmark risk, as measured by the annualised standard deviation of monthly returns. This, ex ante, implies a positive Sharpe ratio of 1.
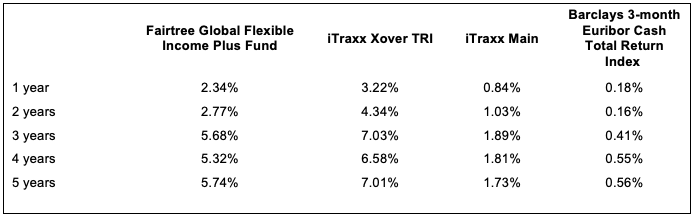
Table 4 shows the total performance of the Fairtree Global Flexible Income Plus Fund relative to the iTraxx XOver Total Return Index, the iTraxx Main Total Return Index, as well as the Barclays 3-month Euribor Cash Total Return Index over various historic periods. The total returns vary from 1 month to 5 years, arguably showing the short, medium and longer run performance numbers. One should take note that the indices carry no fees, whilst the fund performance is in accordance with Class A, which has a TER of 0.97% per annum as currently reported by Bloomberg. When one observes the table, it is quite apparent that the Fairtree Global Flexible Income Plus Fund has delivered very stable annualised performance numbers across all time periods, both from an absolute as well as a relative basis. The fund has outperformed its benchmark on an after-all-fees basis over the 5-year period but has underperformed by around 0.70% per annum over the other measurement periods. This suggests outperformance of around 0.3% per annum on a pre fees basis.
Table 4: Fairtree Global Flexible Income Plus Fund (Class A) historic annualised total returns to end Q1 2025
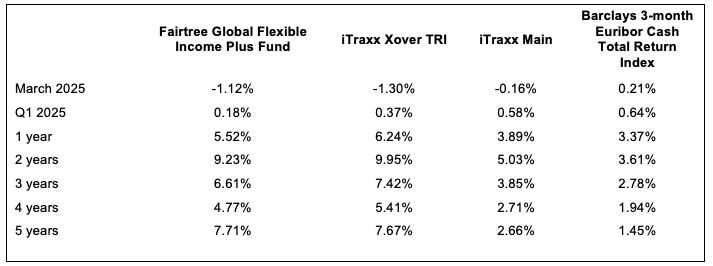
Source: Bloomberg, 31 March 2025
Table 5 shows the risk of the Fairtree Global Flexible Income Plus Fund, the benchmark iTraxx XOver Total Return Index, the iTraxx Main Total Return Index, and the Barclays 3-month Euribor Cash Index. It is interesting to note that the fund has delivered substantially less risk than the benchmark over all periods, which highlights its defensive posture since inception.
Table 5: Historic annualised risk to end Q1 2025
Source: Bloomberg, 31 March 2025
Looking to the 2nd quarter of 2025, the weakness in global credit markets has allowed us to increase the risk of the fund, and the spread to 3-month EURIBOR has risen to some 400 bps. With 3-month EURIBOR having reduced to 2.34%, the current yield of the fund is around 6.34% on a pre-fee’s basis. Using 1-year EURIBOR swaps to determine a forward yield, and then subtracting the TER of 0.97%, results in a pro forma 12-month outlook of around 5.3%. This, of course, is our central case, and there is a distribution around this number. Of course, the fund will be affected by the trials and tribulations of global credit markets but given the fact that the fund is currently defensively positioned, the managers will continue to nibble high-yielding assets into any weakness.
Looking to the 2nd quarter, the markets will be jostling with the potential of continued global political instability. The backdrop remains fluid, with managers facing the conundrum of increasing portfolio risk in an ever-increasing risky backdrop. For those that have the capacity to take on more risk, this may prove to be a great opportunity, but unfortunately, as is normally the case, most managers were already fully invested in the sell-off and do not have the means or the appetite to buy into further weakness. Luckily, due to our disciplined approach to beta exposure, we have ample liquidity in the fund, which will be deployed as the opportunities present themselves. The portfolio will definitely be reshaped in any prolonged or temporary bear market.
Topics
Disclaimer
Fairtree Asset Management (Pty) Ltd is an authorised financial services provider (FSP 25917). Collective Investment Schemes in Securities (CIS) should be considered as medium-to-long-term investments.
Disclaimer
Fairtree Asset Management (Pty) Ltd is an authorised financial services provider (FSP 25917). Collective Investment Schemes in Securities (CIS) should be considered as medium-to-long-term investments.

Fairtree Global Equity Fund Q1 2025 Commentary
The fund returned 1.49% for the quarter, outperforming the benchmark by 2.81%. Global markets saw a sharp downturn in March as US tariffs continued to weigh on investor sentiment, with the U.S. declining 5.9% over the month. The MSCI Emerging Markets Index increased by 2.9%. China and Brazil posted strong returns, increasing 15% and 14% respectively (all in USD).
U.S. equities ended the quarter 4.6% lower, pressured by escalating tariff announcements and policy uncertainty out of Washington. March was marked by rapid policy shifts from President Trump, with tariffs, inflation, employment, and consumer spending driving market concerns. Sentiment weakened further amid rising layoffs, retail warnings, and government job cuts. The Fed left interest rates unchanged at 4.25% – 4.50% during its March meeting due to increased economic uncertainty. They also lowered the GDP growth forecast to 1.7% from 2.1% for 2025, indicating more moderate economic activity than anticipated, while the unemployment rate increased slightly to 4.2%. Shares of AI-related US companies experienced pronounced volatility over the quarter following the release of Deepseek, a Large Language model from China that was trained at significantly lower cost, but still able to produce similar results to current US models. European shares ended the quarter 10.5% higher with the ECB reducing interest rates by 0.25% to 2.5%, marking the sixth cut since June 2024. The ECB revised its GDP growth projections downward, expecting the Eurozone economy to expand by 0.9% in 2025, down from the previous estimate of 1.1%. German equities increased 15.5% over the quarter, responding positively to the announcement of increased public spending and potential tax cuts. UK equities were up 9.7%, while the Bank of England left its interest rates unchanged at 4.5%, warning of global trade uncertainty. Within Emerging Markets, China experienced a strong rally, driven by government initiatives to stabilise the economy, such as reduced interest rates, financial support for the property sector, and increased liquidity. Chinese companies’ advancements in AI have reinforced their position as a significant force in the technology sector. Brazilian equities rose 14%, supported by a substantial trade surplus, resilient investor sentiment, and continued foreign inflows despite global trade tensions.
On a sector level, information technology and consumer discretionary were the worst-performing sectors of the quarter. The Information Technology underweight added to fund performance, while stock picking within the Consumer Discretionary sector added to absolute and relative performance. Financials and healthcare were the two best-performing sectors over the quarter, with the underweight in financials marginally detracting from relative performance, while the overweight in healthcare and other Defensive sectors contributed to relative performance.
Noteworthy portfolio actions over the quarter included selling the fund’s positions in Goldfields, Bidcorp, Shell, and TotalEnergies, while BP was trimmed. Oil prices headed higher during March despite growing recession risks, resulting in the risk-reward on the energy names deteriorating significantly as their share prices followed oil higher. We trimmed our positions in Alibaba and Coca-Cola, while Abbott was exited following strong performances. The defensive names performed well over the quarter as market participants flocked for safety. The existing positions in technology names, Microsoft, Nvidia, Alphabet, Amazon and Broadcom, were topped up into share price weakness. These are high-growth companies that have significantly deteriorated. We also topped up positions in Kaspi and Evolution, while a new position was initiated in Oracle and JP Morgan.
Notable contributors to fund performance were positions in Alibaba (+143bps absolute, +131bps relative), Pinduoduo (+76bps absolute, +74bps relative) and Jd.com (+58bps absolute and relative). Notable detractors from performance over the quarter came from Google (-76bps absolute, -30bps relative), Microsoft (-49bps absolute, -9bps relative) and Amazon (-36bps absolute, -2bps relative).
The fund is positioned with a large underweight in the Cyclical names, as we see a growing risk of a recession in the US economy. The strong rally in our Chinese e-commerce holdings was used to reduce the EM technology exposure and redeployed into DM technology names, although we maintain a higher-than-average cash holding. The fund remains overweight China through the Chinese technology shares and Kazakhstan through Financial shares.
Topics
Disclaimer
Fairtree Asset Management (Pty) Ltd is an authorised financial services provider (FSP 25917). Collective Investment Schemes in Securities (CIS) should be considered medium- to long-term investments. The value may go up and down, and past performance is not necessarily a guide to future performance.

Fairtree Global Listed Real Estate Fund Q1 2025 Commentary
The first quarter was turbulent for global equities. The Fund underperformed the benchmark by 65 bps as the benchmark increased by 159 bps, while the Fund increased by 94 bps. This was driven mainly by the first and second bites of the apple, region and sector allocation, which detracted from performance by 136 bps, partially offset by the third bite of the apple, stock selection, which buoyed performance by 61 bps. We held a 3% cash position, which had a negligible impact on performance. Stocks traded very differently during the first and second parts of the quarter. Initially, the property stocks traded well on solid Q4 2024 earnings announcements and the anticipation of several interest rate cuts in 2025. However, March was a volatile month due to choppy macro news flow, an environment that will likely persist for the foreseeable future. As a result of US tariff increases, long-term US interest rates have fluctuated, while US and global GDP growth forecasts have been cut. The impact of lower GDP growth is unequivocally negative for property stocks, although the sensitivity varies substantially between property sectors. The impact on interest rates is even more complex, with tariffs likely to be inflationary, while slower growth is deflationary.
During the first quarter, Japanese developers were the top performers, with Japanese REITs placed third, up 15% and 9%, respectively. Japan has benefited from stronger growth than previously and more recently from its safe-haven status in an uncertain global environment. However, we remain underweight in Japan, given its demographic challenges, ample supply and rising interest rates. The second-best performers were the Hong Kong REITs, up 10%, although the developers were flat. We are overweight Hong Kong, given attractive valuations, and likely China and Hong Kong government stimulus measures to offset the impact of increased tariffs. Singapore developers and REITs were up 6-7%. The UK is our most overweight region, which was up 4% for the quarter, and we continue to prefer the strong balance sheets and decent fundamentals available in this geography. The EU was up 2%, in line with the index. We are underweight Australia, the worst performing region, down 7%, largely due to being negatively disposed towards index heavyweight Goodman, which is expensive due to data centre hype. The US was the second worst-performing region, and we maintain our underweight on valuation grounds as we reassess the sectors post the tariff announcements.
On a US sector basis, healthcare performed the best, up 15%, as the bright outlook for senior housing demand, given an ageing population, continues to impress. However, this sector is now our largest underweight because of stretched valuations, even assuming aggressive growth. The second-best performing sector was triple net lease, up 9%, as the market looked ahead to interest rate cuts, which post-tariffs, are now less certain. Industrial stocks rose 5%, and we were overweight as supply was set to fall substantially in the second half of 2025, and demand was picking up. However, the industrial demand outlook is now looking substantially weaker as growth stalls and expansion plans are put on hold due to the uncertain tariff environment. Residential also performed positively, up 3%, but we remain underweight as housing affordability remains weak and the job market looks less positive. The rest of the US sectors performed poorly during the first quarter. The weakest sector was lodging, down 18%, where we have zero weighting because of cyclical and structural headwinds. Data centres were down 14%, and we remain cautious on the back of record supply and historically weak margins. Shopping centres were down 10%, but we remain overweight on relatively more stable fundamentals and attractive valuations. Malls were down 4% for the quarter after rallying in 2024, and discretionary spending looks vulnerable. Offices were down 10%, but we are overweight because of falling vacancy rates and decent rental growth for quality space. The likely slowdown in GDP growth post-tariffs could delay this thesis.
This quarter, the top-performing stocks in our portfolio were EU industrial stock Warehouse De Pauw, up 21%, followed by Japanese developer Mitsubishi Estate, up 16%, and Aussie diversified group Mirvac, up 12%. We have exited the Mirvac position as fundamentals weakened during the quarter. The worst-performing stocks were all from the US. Data centre stock Digital Realty and West Coast office stock Kilroy were both down 19%, the former on the back of ample supply and uncertain margins and the latter on the back of still high office vacancies and concerns over technology sector office job growth. Mall stock Macerich was down 14% on the back of a weaker outlook when they announced results.
The first quarter was challenging for equities, and that has continued into the second quarter. The environment is likely to remain volatile as the various geographies react to the higher US tariffs in different ways, and the impact on the economies becomes clearer. We remain overweight in the UK, where tariffs are lower and balance sheets are more resilient than on the continent, and in Hong Kong, where weak fundamentals are already reflected in valuations and government stimulus is likely. We are underweight in the US, where valuations are relatively full, and fundamentals are being buffeted by unpredictable policy changes. Property stocks have significantly outperformed the overall market over the last month, and that relative outperformance is likely to continue on the back of attractive relative valuations and more defensive fundamentals than the overall market.
*Commentary is based on USD returns, gross of investment charges, as at the close of US markets (16h00 EST) on the last trading day of the month. This may differ from ZAR returns, which are shown net of investment charges, as at 15h00 CAT on the last trading day of the month.
Topics
Disclaimer
Fairtree Asset Management (Pty) Ltd is an authorised financial services provider (FSP 25917). Collective Investment Schemes in Securities (CIS) should be considered as medium to long-term investments.
Disclaimer
Fairtree Asset Management (Pty) Ltd is an authorised financial services provider (FSP 25917). Collective Investment Schemes in Securities (CIS) should be considered as medium to long-term investments.

Fairtree SA Equity Prescient Fund Q1 2025 Commentary
Market dynamics
Market Overview
The FTSE/JSE All Share (ALSI) Index, Capped Shareholder Weighted (Capped SWIX) Index, and Shareholder Weighted (SWIX) Index all increased by 6.0% during the quarter. Industrials and Resources increased by 3.1% and 30.0%, while Financials decreased by 1.8%. The rand appreciated by 2.8%, ending the quarter at R18.3 against the US dollar.
During Q1, Bonds increased by 0.7% and Cash returned 1.9%. The MSCI Emerging Market Index increased by 2.9% (in USD), outperforming the MSCI World Index, which decreased by 1.8% (in USD). The MSCI South Africa Index increased by 13.8% (in USD).
During Q1, Iron ore increased by 1.6% to US$96.7/t and Brent crude oil increased by 1.6%, ending at US$74.8/bbl. Copper increased by 11.6% to US$9658.7/t. Gold increased by 19.0% to US$3123.6/oz, Platinum increased by 10.0% to US$997.8/oz and Palladium increased by 8.6% to US$990.7/oz.
The VIX Index (Volatility or “Fear” Index) increased by 28.4% to 22.3 during Q1.
Economic Overview
2025 began with caution and volatility as the market tried to anticipate what US President Donald Trump’s new administration would announce with regards to policy, taxes and trade tariffs. Trump’s playbook of announcing steep tariffs followed by negotiations to extract concessions created volatility, as well as concerns that higher US trade barriers will be inflationary for the US and negative for economic growth. This concern was echoed when the Federal Reserve paused rate cuts, citing solid US economic data and stickier inflation.
Germany abandoned its long-standing fiscal conservatism, lifting its spending cap and approving a defence budget boost. While the threats of escalating tariffs skew near-term growth risks to the downside, medium-term prospects have been boosted by seismic changes in Europe’s approach to defence spending. Diplomatic tensions in Europe escalated as a fallout between the US and Ukraine stalled peace negotiations.
Resources outperformed, led by gold, which rose as investors flocked to safe havens. Our positions across precious metals contributed to performance. We remain bullish on gold driven by central bank purchases, geopolitical tensions and the possibility of structurally higher inflation.
The global AI race faced disruption when Chinese company DeepSeek released a competitive AI model at a fraction of the cost of its US counterparts. This development triggered a reassessment of US exceptionalism and raised questions about AI investment returns. The Chinese AI-driven rally benefitted Prosus, which contributed to performance. This was somewhat muted when Prosus announced the acquisition of European-listed Just Eat Takeaway. The announcement created market concern regarding the company’s capital allocation, given a rather poor track record.
Heightened uncertainty weighed on risk sentiment, keeping the USD strong and exerting pressure on emerging markets. Furthermore, South Africa found itself in Trump’s crosshairs, as the expropriation bill raised questions about the sustainability of AGOA trade benefits.
South Africa has been hit by two major headwinds: political instability within the Government of National Unity (GNU) and new global reciprocal tariffs announced by the Trump administration.
Tensions between GNU partners were always expected, and recent developments have underscored the challenges of co-governing while maintaining party identities. Since last year’s election, South Africa has entered a new phase where no single party holds full responsibility for the country’s future. The delay of the February 2025 budget illustrates the shifting power dynamics. The key question is whether the GNU’s composition will allow for economic reform and support growth. Market reactions suggest growing concerns that changes within the coalition could lead to weaker policy outcomes, and we have seen the ZAR dislocate from fundamentals due to these risks.
On the local front, discretionary retailers provided trading updates that were softer than expected following strong sales guidance provided towards the end of 2024. This detracted from performance along with our exposure to domestic financials.
Portfolio performance
The Fund’s retail asset class returned 4.36% during the quarter, underperforming the FTSE/JSE Capped Shareholder Weighted (Capped SWIX) Index by 119 bps. The Gold sector was the key performance contributor during Q1. The Fund’s performance was positively impacted by positions in Goldfields (67.26%), AngloGold (66.83%), as well as the Discretionary sector with Prosus (12.36%), Naspers (8.26%) and Anheuser (20.54%). Positions in Mr Price (-24.95%), Glencore (-19.44%), Truworths (-27.50%), FirstRand (-5.42%), and Foschini (-26%) detracted from performance.
Portfolio positioning and outlook
The year will remain dominated by volatility as the market tries to anticipate Trump’s policies which remain a random walk and the pace of easing by the Fed. Heightened uncertainty will benefit gold, and we remain bullish on gold, driven by continued central bank purchases, geopolitical tensions and the heightened risk of recession in the US.
The overarching macro theme for China in 2025 will be rising external hostilities amid prolonged domestic economic hardship. It remains unclear if we have reached the true bottom of the property market slump, which in turn keeps domestic confidence subdued. Chinese policymakers will face significant challenges as they navigate this perfect storm.
Domestically, the delay of the Budget increased concern about whether the new government coalition can remain intact long enough to drive meaningful reform. Foreign relations will be a key theme for the year ahead and will be closely scrutinised, with South Africa being no exception. The expulsion of the ambassador from the US has added to this pressure, underscoring foreign policy tensions within South Africa’s coalition government.
The outlook for 2025 is challenging to forecast and uncertain. Thus, we have ensured that the portfolio has liquidity and diversification to position it for many possible outcomes. While uncertainty and volatility are concerning, they often create compelling opportunities, which we will continue to pursue.
Topics
Disclaimer
Fairtree Asset Management (Pty) Ltd is an authorised financial services provider (FSP 25917). Collective Investment Schemes in Securities (CIS) should be considered as medium to long-term investments.
Disclaimer
Fairtree Asset Management (Pty) Ltd is an authorised financial services provider (FSP 25917). Collective Investment Schemes in Securities (CIS) should be considered as medium to long-term investments.