Fairtree Balanced Prescient Fund Q2 2025 commentary


Tariffs, Geopolitics, Wait and See
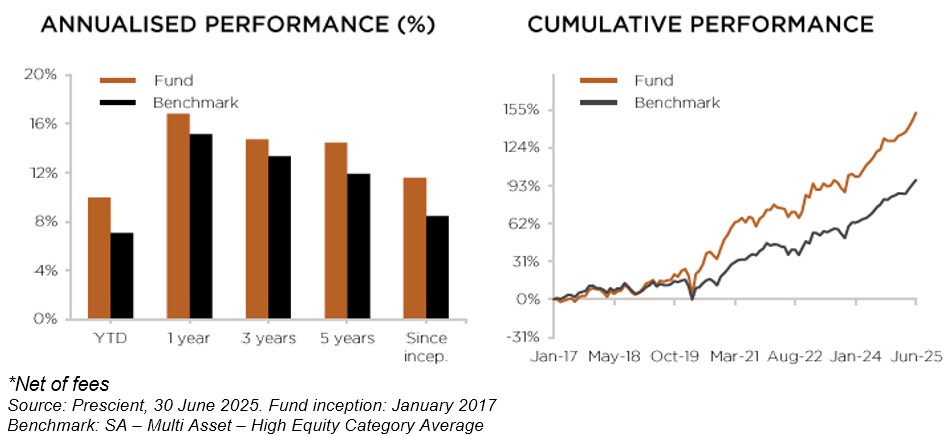
The fund returned 6.73% over Q2-2025 and 9.95% year to date. The fund outperformed its peer group over the quarter and remained within the top decile year to date.
Over 3 and 5 years, the fund continues to be ranked within the top 10% of its peer group. The fund aims to provide investors with significant positive real returns and has outperformed inflation by 5% or more over the last 12 months, 3 years, 5 years and since inception.
We anticipate continued macroeconomic uncertainty throughout 2025. Global investors remain cautious amid evolving geopolitical tensions and shifting trade policies. In the US, ongoing tariff measures and mixed policy signals have weighed on sentiment, prompting a more defensive approach. In Europe, the mood is tentatively positive, underpinned by fiscal spending and supportive monetary policy. In emerging markets such as China, local policy support, easing potential, a weaker US dollar, lower oil prices and innovation in key sectors are helping to stabilise outlooks, although global risks continue to act as a drag.
South African sentiment is more cautiously optimistic. While the stronger rand and safe haven inflows point to resilience supported by commodity demand, a new inflation target, lower yields and improved terms of trade. However, political uncertainty is dampening confidence. The SARB’s decision to cut the repo rate (25bps) reflects economic support. Market sentiment remains cautiously optimistic, though structural and political headwinds persist. Risks to growth have tilted to the downside.
Our portfolio is diversified, highly liquid, and built to navigate a range of macro scenarios. We maintain a defensive allocation in developed markets and a more opportunistic view in emerging markets. We are overweight in government bonds globally and locally, while holding an underweight in equities, particularly in the US. We continue to favour domestic assets. The portfolio is structured to withstand slowing growth, geopolitical uncertainty, and persistent inflation pressures. We are neutral on cash, pending clearer signs of a broader global slowdown. While overall positioned defensively, we hold targeted positions that stand to benefit from improving conditions in China and South Africa.
In this environment, active management and adaptability remain essential. Our strategy is anchored in robust top-down macro insights, supported by disciplined bottom-up research.
Macro overview
The second quarter was marked by volatility, with markets shaken by renewed trade war concerns and direct conflict between Iran and Israel. Yet, despite the turbulence, financial markets held up well, risk assets generally moved higher, and several US Big Tech shares recovered from earlier lows. Emerging market equities and bonds also performed strongly.
The US economic data continued to slow in Q2 after GDP contracted by 0.5% in Q1 due to higher imports amid tariff concerns and weaker consumer spending. While employment remained resilient, consumer sentiment and household consumption softened. Inflation moderated, prompting several global rate cuts, while the Fed held steady as inflation remained sticky around 3% and the outlook uncertain. The Fed signalled a readiness for future rate cuts, highlighting downside risks to growth. Equity markets rallied strongly, hitting record highs by quarter-end, led by big tech and AI-related stocks, particularly the “Magnificent Seven,” which delivered double-digit returns. The Nasdaq outperformed, driven by names like Nvidia, while the S&P 500 and Dow also posted solid gains. Market performance was underpinned by strong Q1 earnings and renewed interest in growth stocks, as well as a shift to risk-on sentiment supported by easing inflation, improving trade talks, and expectations of policy support.
The US Treasury market saw a steepening yield curve in Q2, with long-term yields rising on fiscal concerns and short-term yields falling as softer data made the Fed more dovish. Fiscal concerns rose in May over rising debt, weak bond auctions, tax cuts, and after Moody’s downgraded the US credit rating. Yields fell again in June as some Fed members signalled support for rate cuts if inflation stayed low, though Chair Powell stuck to a cautious stance.
European sovereign bond yields fell in Q2, especially on shorter-dated bonds, driven by weaker growth expectations following US tariff threats and easing inflation. The ECB cut rates twice, bringing the main rate to 2.00%, while signalling the easing cycle may be nearing its end. Equities in the region gained, supported by the delay in US tariffs on EU imports, the ECB’s rate cuts, and a stronger euro. Germany showed signs of recovery, with the Ifo business climate index hitting a one-year high. Industrials and real estate led equity gains, while consumer discretionary, energy, and healthcare lagged.
Emerging market equities delivered strong returns in Q2. The performance was supported by improving trade sentiment, a weaker US dollar, lower oil prices and structural improvements in key regions. China rebounded from April lows as the US reached a trade truce with China. AI optimism and state support for the property sector also increased, though weak domestic data capped gains.
UK equities posted solid gains in Q2, with the FTSE 100 reaching a record high in June as markets stabilised following early-April tariff tensions and the UK struck a trade deal with the US. The Bank of England cut rates by 25bps to 4.25% in May, which, along with Governor Bailey’s call for closer EU ties, further boosted sentiment.
Commodities were the standout performers in Q2 2025. Gold briefly hit a record US$3,500/oz before ending the quarter up 6% at US$3,303, supported by geopolitical risk, central bank buying, and a weaker US dollar. The broader commodity complex performed well, and industrial metals like copper also gained before Trump announced a 50% tariff on copper imports. Oil fell 10% to US$67/barrel, with prices dragged down by oversupply concerns despite a temporary spike during the Middle East conflict.
South African equities ended Q2 in positive territory, led by a strong rebound in the resources sector, particularly platinum group metals and gold miners. Improved political stability and investor confidence supported a 1.62% appreciation in the rand to R17.71/USD. Bond yields declined across the curve, supported by a 25bps rate cut from the SARB and comments suggesting a new 3% inflation target could be announced soon. This shift in tone, alongside a more favourable inflation outlook, helped anchor expectations. Inflation remained subdued, with headline CPI at 2.8% and core inflation at 3.0%. While economic growth remains weak, with Q1 GDP rising just 0.1% q/q and 0.8% y/y, slow structural reforms and improved macro stability are bolstering medium-term prospects.
Government of National Unity (GNU) dominating headlines in Q2. After early disagreements over the National Budget, the GNU managed to pass a revised fiscal framework, seen as a positive signal by markets. Sentiment was further supported by President Ramaphosa’s trip to the US alongside DA leader John Steenhuisen, where they presented a united front in talks with President Trump. However, cracks in the coalition reappeared in June when Ramaphosa dismissed a senior DA cabinet member, prompting the DA to boycott the upcoming National Dialogue.
Market review
Global equity markets rebounded from Q1. Global equities rose 7.7%%, while ex-US equities outperformed with 12%. US equities rose 11% mostly led by the strong performance of the large consumer technology stocks. The equally weighted S&P500 was up 3.4% over the quarter, showing how concentrated the US equity rally is. Europe was up 2.5% and Emerging Markets up 12%. Within Emerging Markets, China 2% and South Africa outperformed 13.6%.
SA Equities (Capped SWIX) was up 9.7% over the quarter. SA industrials was the best performing sector, up 12% (with Naspers/Prosus and MTN performing the best within the index), and SA resources was up 9.8% predominantly driven by gold stocks (Anglogold Ashanti and Anglo America performing well) and PGM stocks (Valterra and BHP performing well). The rand appreciated around 3.5% over the quarter against the US dollar.
During the quarter, the South Africa All Bond index rose 5.9% and cash returned 1.9%. The Bloomberg Barclays Global Aggregate Bond Index gained 0.9% over the quarter.
Commodities were strong in general, with Palladium (11.7%), Gold (5.8%) and Platinum (36.2%) the strongest performers.
The US dollar weakened by 7% against the major currencies as policy uncertainty increased and the growth outlook weakened.
Portfolio performance
The Fund returned -0.3% over Q4 2024 and 13.4% over 2024. The Fund underperformed its peer group over the quarter but outperformed over the year.
The fund returned 6.73% over Q2-2025 and 9.95% year to date. The fund outperformed its peer group over the quarter and remained within the top decile year to date. This outperformance was primarily driven by the positive contribution from asset allocation, offsetting the negative contribution from security selection. Our security selection within SA Equity, Global and Emerging Market Equity detracted from excess returns, while security selection within Commodities and SA Property contributed to excess returns.
Our SA Equity exposure underperformed the FTSE/JSE Capped Shareholder Weighted (Capped SWIX) Index. Our overweight exposure to Gold Miners was the key performance contributor during the quarter, along with our overweight position in Prosus & Naspers. This was more than offset by negative contributions from our overweight positions in General Retail & Diversified Miners and underweight exposure towards PGM Miners and Global Defensive stocks like Richemont & British American Tobacco.
Within Global Equity, overweight exposure to Technology contributed, while overweight exposures to Consumer Discretionary and Financials detracted.
Within Commodities, our overweight in Gold and Platinum contributed to excess returns.
Within asset allocation, our decisions to be overweight SA Equity and Emerging Market Equity and underweight Global Equity worked in our favour. Our overweight in Commodities also contributed, while being overweight in US Treasuries detracted.
Portfolio positioning
Within this environment of unpredictable policy setting, we remain focused on portfolio diversification, flexibility, and liquidity. Not only is the portfolio diversified across asset classes, sectors, and stocks, but also various potential economic outcomes. As the probability of tail events rises, the ability and willingness to move the portfolio quickly increase.
Our portfolio has both defensive and opportunistic characteristics. We are defensively positioned for a slowdown in the US, where valuations are higher and the central bank is constrained by sticky inflation, while opportunistically positioned to take advantage of a recovery in emerging markets, including China and South Africa, where valuations are more attractive and central banks have more scope to ease policy. The overall macro environment, however, may continue to swing between a state of decent growth & sticky inflation and a state of labour market concerns & continued disinflation.
We therefore remain overweight SA Equities and Emerging Market Equities and underweight Global Equities. We have trimmed our underweight to SA Property and remained overweight SA Bonds as the outlook for lower funding cost improved, along with better fiscal dynamics and increased foreign participation. We remain underweight in Global Property. We remain overweight in Global Fixed Income, which will benefit from a US economic slowdown. We are overweight Commodities, particularly gold and platinum, as they continue to benefit from rising geopolitical tension.
We remain overweight SA Equities and underweight Global Equities, in particular US equities, where valuations are elevated, rates are high, and signs of a slowing consumer are emerging. We are more constructive on Emerging Markets and, particularly, China, where policymakers have accelerated policy easing in response to weak economic data and Fed easing. Valuations here remain attractive as a lot of bad news has already been priced into assets. Over 2024, we have increased our exposure to SA economy-facing sectors and continue to hold these.
We have a tactical underweight in SA Property after strong performance last year. While property fundamentals have improved, especially for retail and industrial, the overall outlook remains uncertain in the short term. We remain underweight Global Property.
We remain overweight in both SA and Global Fixed Income, which will benefit from a US economic slowdown. Local bond yields have fallen significantly but remain attractive on a relative and absolute basis given the outlook for lower inflation, rate cuts, fiscal consolidation and increased foreign flows into the asset class.
We are overweight Commodities, particularly gold and platinum. Gold has done well on geopolitical tensions and central bank diversification.
Notes: MSCI country indices used where no index is shown. Internal index currently consists of 45% FTSE/JSE Capped Swix, 25% MSCI AC World, 2% FTSE SA Listed Property Index, 2.5% FTSE EPRA NAREIT Developed Index, 1.5% Equal Weighted SA Commodity ETFs, 18% All Bond Index & 4% STEFI & 2% US Overnight Cash.
Topics
Values-driven investing
Download our Factsheet
Download the monthly factsheet to view comprehensive information and performance data.


We are Fairtree
Subscribe to our newsletter
Stay informed with the latest insights and updates. Subscribe to our newsletter for expert analysis, market trends, and investment strategies delivered straight to your inbox.

"*" indicates required fields

FAIRTREE INSIGHTS
You may also be interested in
Explore more commentaries from our thought leaders, offering in-depth analysis, market trends and expert analysis.


Fairtree Global Flexible Income Plus Fund Q2 2025 Commentary
After the very slow start for US equities during the first quarter, and the superior performance emanating from the EU and the UK, the second quarter witnessed a turnaround in fortunes with the tech-heavy NASDAQ delivering its fourth-best quarterly performance number over the past 18 years.


Fairtree Global Equity Fund Q2 2025 Commentary
US equities ended the quarter 11.2% higher; however, they experienced pronounced volatility following President Donald Trump’s ‘Liberation Day’ announcements of tariffs on imported goods.

Fairtree BCI Income Plus Fund Q1 2025 Commentary
It was a complete turnaround in the fortunes of global equities in the first quarter of 2025. The 47th US President was sworn in during the period, and contrary to popular opinions, the US stock market took a bit of a beating from a relative perspective.
Disclaimer
Fairtree Asset Management (Pty) Ltd is an authorised financial services provider (FSP 25917). Collective Investment Schemes in Securities (CIS) should be considered as medium to long-term investments. The value may go up as well as down, and past performance is not necessarily a guide to future performance.
CISs are traded at the ruling price and can engage in scrip lending and borrowing. A schedule of fees, charges and maximum commissions is available on request from the Manager. A CIS may be closed to new investors for it to be managed more efficiently in accordance with its mandate. Performance has been calculated using net NAV to NAV numbers with income reinvested. The performance for each period shown reflects the return for investors who have been fully invested for that period. Individual investor performance may differ as a result of initial fees, the actual investment date, the date of reinvestments and dividend withholding tax. Full performance calculations are available from the manager on request. There is no guarantee in respect of capital or returns in a portfolio. Prescient Management Company (RF) (Pty) Ltd is registered and approved under the Collective Investment Schemes Control Act (No.45 of 2002). For any additional information, such as fund prices, fees, brochures, minimum disclosure documents and application forms, please go to www.fairtree.com.
Highest rolling one-year return is 57.79% (Benchmark 30.65%), and the lowest rolling one-year return -9.29% (Benchmark: -10.47%) (information to 30 June 2025). The fund has returned an annualised return of 11.57% since inception (January 2017) (benchmark annualised return of 8.45% since inception). The fund’s annualised performance over 1 year is 16.83% (Benchmark: 15.15%). The funds’ annualised performance over 3 years is 14.73% (Benchmark: 13.35%). Fund returns disclosed are annualised returns net of investment management fees and performance fees. Annualised return is weighted average compound growth rate over the period measured. Fund investment risk indicator level: moderately aggressive. Full performance calculations are available from the manager on request. Annualised performance shows longer term performance rescaled to a 1-year period. Annualised performance is the average return per year over the period. Actual annual figures are available to the investor on request. Highest & Lowest return: The highest and lowest returns for any 1 year over the period since inception have been shown. NAV: The net asset value represents the assets of a Fund less its liabilities. *The forecasts are based on reasonable assumptions, are not guaranteed to occur and are provided for illustrative purposes only.
This document is confidential and issued for the information of the addressee and clients of Fairtree Asset Management only. It is subject to copyright and may not be reproduced in whole or in part without the written permission of Fairtree Asset Management. The information, opinions and recommendations contained herein are and must be construed solely as statements of opinion and not statements of fact. No warranty expressed or implied, as to the accuracy, timeliness, completeness, fitness for any particular purpose of any such recommendation or information is given or made by the Manager in any form or manner whatsoever. Each recommendation or opinion must be weighed solely as one factor in any investment or other decision made by or on behalf of any user of the information contained herein, and such user must accordingly make its own study and evaluation of each strategy/security that it may consider purchasing, holding or selling and should appoint its own investment or financial or other advisers to assist the user in reaching any decision. The Manager will accept no responsibility of whatsoever nature in respect of the use of any statement, opinion, recommendation, or information contained in this document. This document is for information purposes only and does not constitute advice or a solicitation for funds.
About you…
By proceeding, I confirm that:
- To the best of my knowledge, and after making all necessary inquiries, I am permitted under the laws of my country of residence to access this site and the information it contains; and
- I have read, understood, and agree to be bound by the Terms and Conditions of Use described below.
- Please beware of fraudulent Whatsapp groups pretending to be affiliated with Fairtree or Fairtree staff members.
If you do not meet these requirements, or are unsure whether you do, please click “Decline” and do not continue.