Archives: Resources
Fairtree Equity Explorer | The digital duopoly: Alphabet & Meta in the global ad market | Episode 5


Transcript
Topics
FAIRTREE INSIGHTS
You may also be interested in
Explore more commentaries from our thought leaders, offering in-depth analysis, market trends and expert analysis.


Macro Pulse Episode 21
In this episode Jacobus discusses SA equities, SA bonds and the appreciating of the US dollar.


Fairtree Market Insights with Karena Naidu | Episode 8
In this episode, we dive into our Chinese exposure, exploring what’s happening with the major e-commerce players in China. We also take a closer look at the broader emerging markets space, unpacking key trends and where we’re seeing potential growth.

Macro Pulse Episode 20
In this episode, Jacobus discusses major events leading up to year-end, recent US court cases, and the rise in long bond yields.
Macro Pulse Episode 16

Transcript
Topics
FAIRTREE INSIGHTS
You may also be interested in
Explore more commentaries from our thought leaders, offering in-depth analysis, market trends and expert analysis.
Macro Pulse Episode 21
In this episode Jacobus discusses SA equities, SA bonds and the appreciating of the US dollar.
Fairtree Market Insights with Karena Naidu | Episode 8
In this episode, we dive into our Chinese exposure, exploring what’s happening with the major e-commerce players in China. We also take a closer look at the broader emerging markets space, unpacking key trends and where we’re seeing potential growth.
Macro Pulse Episode 20
In this episode, Jacobus discusses major events leading up to year-end, recent US court cases, and the rise in long bond yields.
Bloemhof Fairtree U16 Hockey Tournament

Transcript
Topics
FAIRTREE INSIGHTS
You may also be interested in
Explore more commentaries from our thought leaders, offering in-depth analysis, market trends and expert analysis.


Leo Matthysen | Proud Partner
For years, Fairtree has supported Leo Matthysen on his tennis journey – from an eight-year-old with a racket and a dream in Mitchell’s Plain to a current South African Davis Cup player.
Macro Pulse Episode 15

Transcript
Topics
FAIRTREE INSIGHTS
You may also be interested in
Explore more commentaries from our thought leaders, offering in-depth analysis, market trends and expert analysis.
Macro Pulse Episode 21
In this episode Jacobus discusses SA equities, SA bonds and the appreciating of the US dollar.
Fairtree Market Insights with Karena Naidu | Episode 8
In this episode, we dive into our Chinese exposure, exploring what’s happening with the major e-commerce players in China. We also take a closer look at the broader emerging markets space, unpacking key trends and where we’re seeing potential growth.
Macro Pulse Episode 20
In this episode, Jacobus discusses major events leading up to year-end, recent US court cases, and the rise in long bond yields.

Fairtree Global Flexible Income Plus Fund Q1 2025 Commentary
Market dynamics
Global risk
It was a complete turnaround in the fortunes of global equities in the first quarter of 2025. The 47th US President was sworn in during the period, and contrary to popular opinions, the US stock market took a bit of a beating from a relative perspective. The Large Cap Dow Jones Industrial Average lost some 0.87% whilst the tech-heavy NASDAQ lost some 10.26% over the period. Several reasons have come through for this, but perhaps more than anything else, it was an excuse the market needed to bring the North American equity indices a little lower in price. One must sometimes remember that the PE ratio of the NASDAQ as at the end of December 2024 was at 40.25 and has derated to 32.4. When one considers that the best performer over the period was the Dax, which delivered over 11%, most of this outperformance was due to a re-rating of its PE, which increased from 16.6 to 17.8 times. This amounted to around 7% in total return, the additional four percent coming from increased earnings. The de-rating of the NASDAQ would have subtracted some 19.5% of return, so obviously the differential has come through increased earnings from that index. All very poignant when one considers what can actually happen if PE ratios normalise from a global perspective. Table 1 below shows the PE ratios of the major equity indices at the end of Q4 2024 and Q1 2025.
Table 1: Major Index Price Earnings Ratios Q4 2024 – Q1 2025
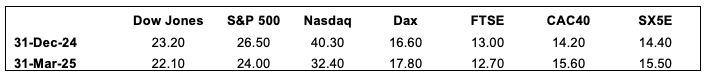
Source: Bloomberg, 31 March 2025
Moving to European credit, the iTraxx suite of indices produced another set of numbers that were marginally in the black. The iTraxx Crossover 5-year Total Return Index produced a rather meagre 0.37%, which underperformed cash at the margin, whilst the 2 times levered index, our more favoured measure of the relative performance of European credit, produced a rounding error from zero at 0.02% for the quarter. These were not particularly great from a historical point of view. Yes, they did remain positive, but only just. From a persistence perspective, one must return to the 2nd quarter of 2022 to find a negative total return from the iTraxx Crossover. For the first time since Q1 2024, the DAX, the FTSE 100, the SX5E and the CAC 40 all outperformed the iTraxx Crossover in total return terms. In fact, of the last 72 quarters, only 22 of those quarters have witnessed European equities outperforming the credit index. When one looks at more of a like-for-like in risk terms by using the 2x levered XOver, that number drops to 14. To reiterate what this means, in the last 18 years of quarterly data, European equities have only outperformed the 2 times levered iTraxx XOver index on 14 occasions.
Table 2: Major Index Q4 2024 Total Return and historic rankings Q2 2007 – Q1 2025
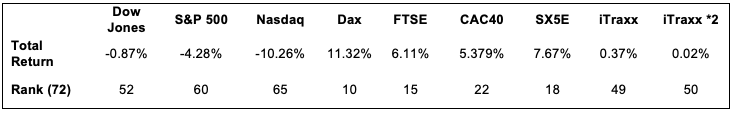
Source: Bloomberg, 31 March 2025
Given that we have 18 years of quarterly data, we can do more than just look at the outright performance numbers and the relative rankings. We can also look at relative risk measures such as standard deviations, Sharpe Ratios, and other measures of risk-adjusted returns. This should be important to investors who do “feel” risk in the diffusion of the performance that they have been delivered. For the same absolute return in a portfolio, only a fool would be happy with more risk for that return than less risk. There are many definitions of what risk is, and what is essential for one investor is quite different from another. Still, we feel that the most consistent and comparable is the time-tested standard deviation, which has its roots in its underlying mathematical construct. This makes it consistent in treating any distribution of potential outcomes. The simple calculation of mean divided by standard deviation gives a good measure of risk-adjusted return and is one that we tend to like to look at. This is not the Sharpe Ratio (SR), as the SR strips out risk-free return as well as the volatility of that risk-free return, but we feel that the basic return per unit risk ratio is a good proxy for the slightly more rigorous SR. A higher number is better as the investor receives more return for accumulated risk. We must be aware, however, that a high number on its own cannot be viewed as the “Holy Grail’ since any low volatility index might deliver high levels of Return Coefficient but might not deliver that much by way of return. By way of an example, it might be foolish to buy an index that produces 0.4% annual return with 0.2% annualised volatility – a return coefficient of 2, rather than an index that produces 12% return with a standard deviation of 8%.
Table 3 shows the annualised returns, the annualised risk, and the return coefficients for the major indices we monitor. These numbers are generated from our historic dataset and therefore do include risk periods such as the Global Financial Crisis (GFC), the Greek Government default crisis, the COVID 19 global pandemic, the more recent Ukraine/Russian War as well as the current war in the Middle East and all the political turmoil in Europe the UK and the United States. Perhaps it is more of the same rather than the exception at the moment, with the world as usual teetering on the brink of the potential for some financial fallout. Still, the traditionalist would suggest that this potential for fallout is the very reason that risk premia exist in the first place. No risk should have risk-free returns; those who choose to take the risk of loss should surely be rewarded. This line of argument would go a long way in explaining persistence in market returns, the “overvaluation” of US equities has been bandied around for the last 2 decades, and yet they continue to outperform their European counterparts. Contrary to popular opinion, the outperformance will more than likely continue until participants accept it as the “new normal”, and when that eventually happens, it will probably be followed by a reversal of fortunes. The relative performance of Europe over the 1st quarter of 2025 is a moot point, but one will need to see a lot more persistence of this to conclude about the “dawning of a new era”. Perhaps, as is always the case in statistics, they perfectly explain the past but say nothing about the future. In accepting this, one realises that solid views still need to be taken to profit from any market dislocation or relocation. Time will be a fantastic teacher in this regard.
From a European perspective, Table 3 highlights the outperformance of credit from a risk-adjusted perspective. The more risk normalised two times levered index solidly outperforms its equity equivalent, offering investors excess return for a given risk target. If investors are comfortable with equity-type risk, they should be more than happy with the extra return that iTraxx*2 has offered. This index goes a long way to close the relative gap to US equities, that gap has closed somewhat during Q1, and provides a rather good fund diversifier to the allocator that has a US strategic overweight.
Table 3: Major Index Price Earnings Ratios Q4 2024 – Q1 2025
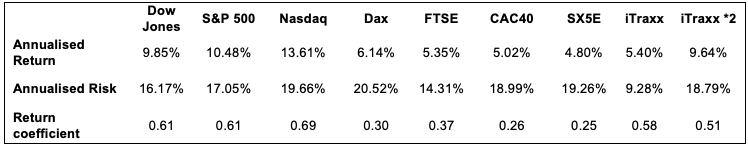
Source: Bloomberg, 31 March 2025
As an extension of last quarter’s report, Figure 1 below shows the cumulative return of the various indices in the currency of the particular index domicile. The different performance traces were indexed to 100 at the beginning of the second quarter of 2007, when we had the complete historical data for the iTraxx XOver and the main total returns.
Figure 1 also shows that there are no returns to risk-free. The worst-performing traces over the past 18 years are the iTraxx Main Index (125 equally weighted global investment-grade credit names) and the US Treasuries total return index. Looking at the delivered risk, it becomes apparent that US Treasuries are not the least risky asset class but rather the well-diversified investment-grade CDS index—iTraxx Main. They have generated the lowest returns coupled with the lowest associated risk over the past 18 years.
Figure 1: Major Index Total Return Q2 2007 – Q1 2025
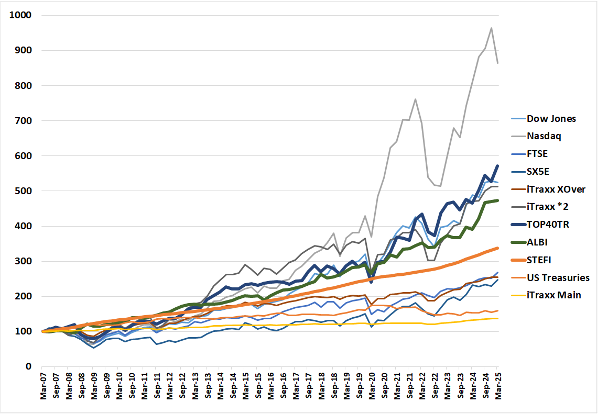
Source: Bloomberg, 31 March 2025
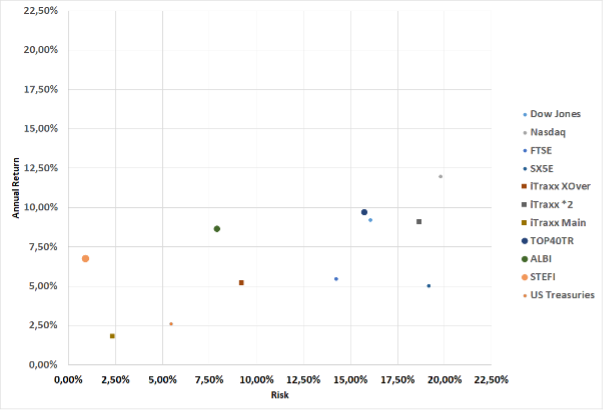
It is difficult to look at the returns and the associated volatility of those returns simultaneously in Figure 1. To disentangle the graphic and the more meaningful comparatives, we produce the delivered risk (as computed by the annualised standard deviation of quarterly returns) and the delivered annualised return over the 18 years. This is shown in Figure 2. If we fit a straight line to this dataset, we would observe an upward slope indicating a positive return to risk. Increase that risk, and it should result in a higher delivered return. The corollary of this is also apparent: a reduction in risk taken will result in a reduced overall delivered return. The textbooks, which have always stated that there needs to be an excess return to risk are indeed correct. The short run is deemed to be random, whilst the more extended run will yield excess return due to the extraction of the various risk premia. As time elapses, the risk premium (or positive slope) becomes more apparent. One heuristic would be that the short run is randomly distributed around a mean and variance, whereas the longer run is an equally weighted “portfolio” of those independent periods. Thanks to the only free lunch in finance, the Central Limit Theorem, the long run results in a normally distributed outcome centred on that delivered risk premium. Mathematics delivers to investors what economists can only posit.
Figure 2: Major Index Risk Return scatterplot Q2 2007 – Q1 2025
Source: Bloomberg, 31 March 2025
The domination in return terms of US equities, which was touched on earlier in this piece, is quite apparent in the figure, but one must be cognizant that these indices are shown in local currency. This explains the relatively good performance of the South African Top40 Total Return index, which is based on the Rand. To do a proper comparative study, we need to translate all the indices.
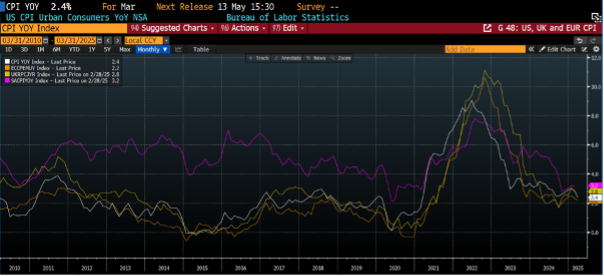
Moving to the economic backdrop, Figure 4 shows inflation in the developed world (US, UK, Eurozone and South Africa), highlighting that inflation is well off its highs in the 4th quarter of 2022. The fact that the disinflationary trend, which started in the US, seems to have slowed down and has resulted in a more cautious response from the central banks. What is interesting to note is the convergence of global headline inflation numbers, irrespective of the economic backdrop. One could argue that the idiosyncratic, or country-specific, inflation is less important than the dominant driver of global inflation. This is not out of phase with what we generally witness in equity markets, where global trends are the major driver of the fortunes of local markets, rather than the economic or political leanings of that country.
Figure 3: Annual Change in Consumer Price Indices March 2010 – March 2025
Source: Bloomberg, 31 March 2025
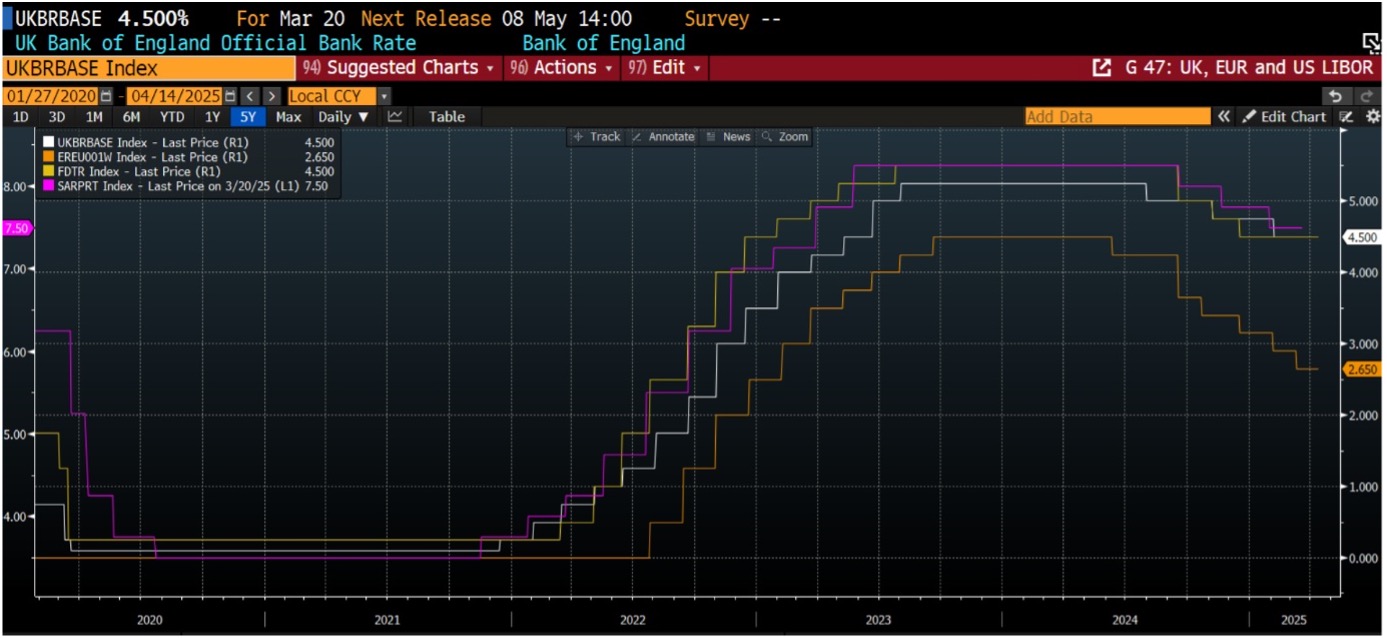
Figure 4 below shows the level of short rates as administered by the US Federal Reserve (Fed), the European Central Bank (ECB), the Bank of England (BoE) and the South African Reserve Bank (SARB). What is of interest to note is the high levels of correlation in both the direction and the extent of policy movement. The other point to highlight is that the response from the ECB has been the most aggressive in terms of timing and extent. The Fed has cut by 100 bps, the BOE 75 bps, the SARB also 75 bps, whilst the ECB has cut by 185 bps and looks to continue with the cutting cycle into Q2.
We do believe that the current uncertain backdrop, where the market is discounting some 100-125 bps of cuts by the Fed by Q1 2026, could extend the cutting cycle of the ECB but we do believe it might be time to pause for some reflection, awaiting the economic data to catch up before venturing into some further aggressive cuts from the ECB. Caution would most probably be warranted now. We do, however, believe that the current cutting excesses will be taken out of market prices over the next quarter, as the “Tariff War” premium unwinds.
Figure 4: Central Bank Administered Rates
Source: Bloomberg, 31 March 2025
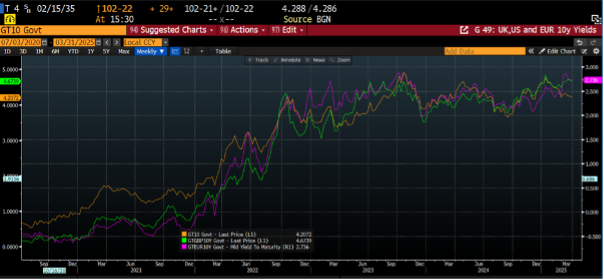
Figure 5 shows the movements in global bond yields. The 10-year US Treasury, the UK Gilt, and the benchmark European Bund are shown in the Figure, albeit using different scales. It is interesting to point out the high levels of correlation between these three traces, and that although short-term disconnects tend to occur, they generally are swiftly reversed.
As is the case with global inflation, the global cost of capital sets trends throughout the major economies, and any disconnect between yields is quickly reversed, and yields are brought back into congruence. Unfortunately for those who deem stock picking to be a long-term value-adding proposition, we would posit that the major driver of performance in a bond fund is beta rather than alpha due to stock selection. In fact, the real driver of the performance of a fixed income fund is the relative duration of that fund in comparison to the appropriate benchmark. The correlation between the different points on the yield curve is just too high to facilitate a stock picking process. It is possible, but the alpha production is so small that most of that alpha is expended in trading costs.
Figure 5: 10-year benchmark yields in the US,UK and EU
Source: Bloomberg, 31 March 2025
Fund performance
The strategy of the fund is to provide investors access to a well-diversified credit portfolio that aims to outperform its benchmark over the long term, with a lower-than-benchmark risk, as measured by the annualised standard deviation of monthly returns. This, ex ante, implies a positive Sharpe ratio of 1.
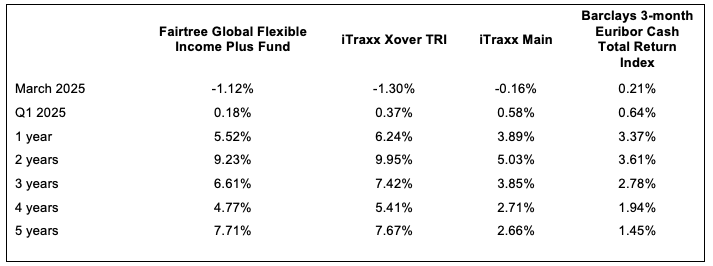
Table 4 shows the total performance of the Fairtree Global Flexible Income Plus Fund relative to the iTraxx XOver Total Return Index, the iTraxx Main Total Return Index, as well as the Barclays 3-month Euribor Cash Total Return Index over various historic periods. The total returns vary from 1 month to 5 years, arguably showing the short, medium and longer run performance numbers. One should take note that the indices carry no fees, whilst the fund performance is in accordance with Class A, which has a TER of 0.97% per annum as currently reported by Bloomberg. When one observes the table, it is quite apparent that the Fairtree Global Flexible Income Plus Fund has delivered very stable annualised performance numbers across all time periods, both from an absolute as well as a relative basis. The fund has outperformed its benchmark on an after-all-fees basis over the 5-year period but has underperformed by around 0.70% per annum over the other measurement periods. This suggests outperformance of around 0.3% per annum on a pre fees basis.
Table 4: Fairtree Global Flexible Income Plus Fund (Class A) historic annualised total returns to end Q1 2025
Source: Bloomberg, 31 March 2025
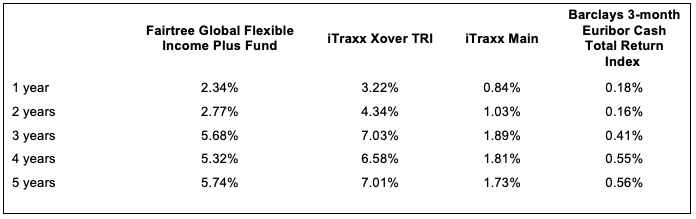
Table 5 shows the risk of the Fairtree Global Flexible Income Plus Fund, the benchmark iTraxx XOver Total Return Index, the iTraxx Main Total Return Index, and the Barclays 3-month Euribor Cash Index. It is interesting to note that the fund has delivered substantially less risk than the benchmark over all periods, which highlights its defensive posture since inception.
Table 5: Historic annualised risk to end Q1 2025
Source: Bloomberg, 31 March 2025
Looking to the 2nd quarter of 2025, the weakness in global credit markets has allowed us to increase the risk of the fund, and the spread to 3-month EURIBOR has risen to some 400 bps. With 3-month EURIBOR having reduced to 2.34%, the current yield of the fund is around 6.34% on a pre-fee’s basis. Using 1-year EURIBOR swaps to determine a forward yield, and then subtracting the TER of 0.97%, results in a pro forma 12-month outlook of around 5.3%. This, of course, is our central case, and there is a distribution around this number. Of course, the fund will be affected by the trials and tribulations of global credit markets but given the fact that the fund is currently defensively positioned, the managers will continue to nibble high-yielding assets into any weakness.
Looking to the 2nd quarter, the markets will be jostling with the potential of continued global political instability. The backdrop remains fluid, with managers facing the conundrum of increasing portfolio risk in an ever-increasing risky backdrop. For those that have the capacity to take on more risk, this may prove to be a great opportunity, but unfortunately, as is normally the case, most managers were already fully invested in the sell-off and do not have the means or the appetite to buy into further weakness. Luckily, due to our disciplined approach to beta exposure, we have ample liquidity in the fund, which will be deployed as the opportunities present themselves. The portfolio will definitely be reshaped in any prolonged or temporary bear market.
Topics
Disclaimer
Fairtree Asset Management (Pty) Ltd is an authorised financial services provider (FSP 25917). Collective Investment Schemes in Securities (CIS) should be considered as medium-to-long-term investments.
Disclaimer
Fairtree Asset Management (Pty) Ltd is an authorised financial services provider (FSP 25917). Collective Investment Schemes in Securities (CIS) should be considered as medium-to-long-term investments.

Fairtree Global Equity Fund Q1 2025 Commentary
The fund returned 1.49% for the quarter, outperforming the benchmark by 2.81%. Global markets saw a sharp downturn in March as US tariffs continued to weigh on investor sentiment, with the U.S. declining 5.9% over the month. The MSCI Emerging Markets Index increased by 2.9%. China and Brazil posted strong returns, increasing 15% and 14% respectively (all in USD).
U.S. equities ended the quarter 4.6% lower, pressured by escalating tariff announcements and policy uncertainty out of Washington. March was marked by rapid policy shifts from President Trump, with tariffs, inflation, employment, and consumer spending driving market concerns. Sentiment weakened further amid rising layoffs, retail warnings, and government job cuts. The Fed left interest rates unchanged at 4.25% – 4.50% during its March meeting due to increased economic uncertainty. They also lowered the GDP growth forecast to 1.7% from 2.1% for 2025, indicating more moderate economic activity than anticipated, while the unemployment rate increased slightly to 4.2%. Shares of AI-related US companies experienced pronounced volatility over the quarter following the release of Deepseek, a Large Language model from China that was trained at significantly lower cost, but still able to produce similar results to current US models. European shares ended the quarter 10.5% higher with the ECB reducing interest rates by 0.25% to 2.5%, marking the sixth cut since June 2024. The ECB revised its GDP growth projections downward, expecting the Eurozone economy to expand by 0.9% in 2025, down from the previous estimate of 1.1%. German equities increased 15.5% over the quarter, responding positively to the announcement of increased public spending and potential tax cuts. UK equities were up 9.7%, while the Bank of England left its interest rates unchanged at 4.5%, warning of global trade uncertainty. Within Emerging Markets, China experienced a strong rally, driven by government initiatives to stabilise the economy, such as reduced interest rates, financial support for the property sector, and increased liquidity. Chinese companies’ advancements in AI have reinforced their position as a significant force in the technology sector. Brazilian equities rose 14%, supported by a substantial trade surplus, resilient investor sentiment, and continued foreign inflows despite global trade tensions.
On a sector level, information technology and consumer discretionary were the worst-performing sectors of the quarter. The Information Technology underweight added to fund performance, while stock picking within the Consumer Discretionary sector added to absolute and relative performance. Financials and healthcare were the two best-performing sectors over the quarter, with the underweight in financials marginally detracting from relative performance, while the overweight in healthcare and other Defensive sectors contributed to relative performance.
Noteworthy portfolio actions over the quarter included selling the fund’s positions in Goldfields, Bidcorp, Shell, and TotalEnergies, while BP was trimmed. Oil prices headed higher during March despite growing recession risks, resulting in the risk-reward on the energy names deteriorating significantly as their share prices followed oil higher. We trimmed our positions in Alibaba and Coca-Cola, while Abbott was exited following strong performances. The defensive names performed well over the quarter as market participants flocked for safety. The existing positions in technology names, Microsoft, Nvidia, Alphabet, Amazon and Broadcom, were topped up into share price weakness. These are high-growth companies that have significantly deteriorated. We also topped up positions in Kaspi and Evolution, while a new position was initiated in Oracle and JP Morgan.
Notable contributors to fund performance were positions in Alibaba (+143bps absolute, +131bps relative), Pinduoduo (+76bps absolute, +74bps relative) and Jd.com (+58bps absolute and relative). Notable detractors from performance over the quarter came from Google (-76bps absolute, -30bps relative), Microsoft (-49bps absolute, -9bps relative) and Amazon (-36bps absolute, -2bps relative).
The fund is positioned with a large underweight in the Cyclical names, as we see a growing risk of a recession in the US economy. The strong rally in our Chinese e-commerce holdings was used to reduce the EM technology exposure and redeployed into DM technology names, although we maintain a higher-than-average cash holding. The fund remains overweight China through the Chinese technology shares and Kazakhstan through Financial shares.
Topics
Disclaimer
Fairtree Asset Management (Pty) Ltd is an authorised financial services provider (FSP 25917). Collective Investment Schemes in Securities (CIS) should be considered medium- to long-term investments. The value may go up and down, and past performance is not necessarily a guide to future performance.

Fairtree Global Listed Real Estate Fund Q1 2025 Commentary
The first quarter was turbulent for global equities. The Fund underperformed the benchmark by 65 bps as the benchmark increased by 159 bps, while the Fund increased by 94 bps. This was driven mainly by the first and second bites of the apple, region and sector allocation, which detracted from performance by 136 bps, partially offset by the third bite of the apple, stock selection, which buoyed performance by 61 bps. We held a 3% cash position, which had a negligible impact on performance. Stocks traded very differently during the first and second parts of the quarter. Initially, the property stocks traded well on solid Q4 2024 earnings announcements and the anticipation of several interest rate cuts in 2025. However, March was a volatile month due to choppy macro news flow, an environment that will likely persist for the foreseeable future. As a result of US tariff increases, long-term US interest rates have fluctuated, while US and global GDP growth forecasts have been cut. The impact of lower GDP growth is unequivocally negative for property stocks, although the sensitivity varies substantially between property sectors. The impact on interest rates is even more complex, with tariffs likely to be inflationary, while slower growth is deflationary.
During the first quarter, Japanese developers were the top performers, with Japanese REITs placed third, up 15% and 9%, respectively. Japan has benefited from stronger growth than previously and more recently from its safe-haven status in an uncertain global environment. However, we remain underweight in Japan, given its demographic challenges, ample supply and rising interest rates. The second-best performers were the Hong Kong REITs, up 10%, although the developers were flat. We are overweight Hong Kong, given attractive valuations, and likely China and Hong Kong government stimulus measures to offset the impact of increased tariffs. Singapore developers and REITs were up 6-7%. The UK is our most overweight region, which was up 4% for the quarter, and we continue to prefer the strong balance sheets and decent fundamentals available in this geography. The EU was up 2%, in line with the index. We are underweight Australia, the worst performing region, down 7%, largely due to being negatively disposed towards index heavyweight Goodman, which is expensive due to data centre hype. The US was the second worst-performing region, and we maintain our underweight on valuation grounds as we reassess the sectors post the tariff announcements.
On a US sector basis, healthcare performed the best, up 15%, as the bright outlook for senior housing demand, given an ageing population, continues to impress. However, this sector is now our largest underweight because of stretched valuations, even assuming aggressive growth. The second-best performing sector was triple net lease, up 9%, as the market looked ahead to interest rate cuts, which post-tariffs, are now less certain. Industrial stocks rose 5%, and we were overweight as supply was set to fall substantially in the second half of 2025, and demand was picking up. However, the industrial demand outlook is now looking substantially weaker as growth stalls and expansion plans are put on hold due to the uncertain tariff environment. Residential also performed positively, up 3%, but we remain underweight as housing affordability remains weak and the job market looks less positive. The rest of the US sectors performed poorly during the first quarter. The weakest sector was lodging, down 18%, where we have zero weighting because of cyclical and structural headwinds. Data centres were down 14%, and we remain cautious on the back of record supply and historically weak margins. Shopping centres were down 10%, but we remain overweight on relatively more stable fundamentals and attractive valuations. Malls were down 4% for the quarter after rallying in 2024, and discretionary spending looks vulnerable. Offices were down 10%, but we are overweight because of falling vacancy rates and decent rental growth for quality space. The likely slowdown in GDP growth post-tariffs could delay this thesis.
This quarter, the top-performing stocks in our portfolio were EU industrial stock Warehouse De Pauw, up 21%, followed by Japanese developer Mitsubishi Estate, up 16%, and Aussie diversified group Mirvac, up 12%. We have exited the Mirvac position as fundamentals weakened during the quarter. The worst-performing stocks were all from the US. Data centre stock Digital Realty and West Coast office stock Kilroy were both down 19%, the former on the back of ample supply and uncertain margins and the latter on the back of still high office vacancies and concerns over technology sector office job growth. Mall stock Macerich was down 14% on the back of a weaker outlook when they announced results.
The first quarter was challenging for equities, and that has continued into the second quarter. The environment is likely to remain volatile as the various geographies react to the higher US tariffs in different ways, and the impact on the economies becomes clearer. We remain overweight in the UK, where tariffs are lower and balance sheets are more resilient than on the continent, and in Hong Kong, where weak fundamentals are already reflected in valuations and government stimulus is likely. We are underweight in the US, where valuations are relatively full, and fundamentals are being buffeted by unpredictable policy changes. Property stocks have significantly outperformed the overall market over the last month, and that relative outperformance is likely to continue on the back of attractive relative valuations and more defensive fundamentals than the overall market.
*Commentary is based on USD returns, gross of investment charges, as at the close of US markets (16h00 EST) on the last trading day of the month. This may differ from ZAR returns, which are shown net of investment charges, as at 15h00 CAT on the last trading day of the month.
Topics
Disclaimer
Fairtree Asset Management (Pty) Ltd is an authorised financial services provider (FSP 25917). Collective Investment Schemes in Securities (CIS) should be considered as medium to long-term investments.
Disclaimer
Fairtree Asset Management (Pty) Ltd is an authorised financial services provider (FSP 25917). Collective Investment Schemes in Securities (CIS) should be considered as medium to long-term investments.

Fairtree Equity Explorer | Rewriting the weight loss playbook with GLP-1s | Episode 4

Transcript
Topics
FAIRTREE INSIGHTS
You may also be interested in
Explore more commentaries from our thought leaders, offering in-depth analysis, market trends and expert analysis.
Macro Pulse Episode 21
In this episode Jacobus discusses SA equities, SA bonds and the appreciating of the US dollar.
Fairtree Market Insights with Karena Naidu | Episode 8
In this episode, we dive into our Chinese exposure, exploring what’s happening with the major e-commerce players in China. We also take a closer look at the broader emerging markets space, unpacking key trends and where we’re seeing potential growth.
Macro Pulse Episode 20
In this episode, Jacobus discusses major events leading up to year-end, recent US court cases, and the rise in long bond yields.
Macro Pulse Episode 14
Topics

Transcript
We’ve seen that the aggressive reciprocal tariffs that was announced, earlier in April has caused a lot of concerns about market participants around higher inflation in The US, as well as slower growth. We believe, therefore, that a stagflation risk still remains out there. A lot of damage has already been done, but we are starting to see that President Trump are trying to make some walkbacks on these tariffs. And most importantly, there’s some news out this week that this weekend, there will be a meeting between The US and China in Switzerland to discuss, the way forward. According to treasury secretary Scott Besant, he said that this meeting will be more around trying to deescalate rather than reaching a trade deal.
But we believe with him as well as James and Grier, which is the trade representative, and from China, Yi Le Feng in the room, we think that there could be enough scope to at least get to some sort of progress towards starting to talk about a trade deal. During Trump’s first hundred days, we’ve seen that the market is down roughly 10%. His approval rating has dropped from slightly above 50 to the mid forties. Markets are concerned about inflation and growth, and we still are sitting with a war that rage raging between Ukraine and Russia. So Trump is in need of some sort of a win.
And, therefore, if we look at the trade scenario at the moment, with a lot of uncertainties allowed there, we also need some wins and some news about potential trade deals coming to the front. So Scott Besant also this week said that there is at least a dozen countries out there that wants to sign trade deals with The US. About 90% of The US global trade deficit comes from about 10 countries. So if we can get a handful of deals signed by these countries, we think that could alleviate a lot of pressure from this market. So overall, we think trade de escalation or trade tension de escalation will continue, but potentially not to the level where it was before and that a lot of the damage and growth has already been done.
And we can see that by looking at the first quarter GDP numbers. We saw that there was a contraction in The US of 0.3% in the first quarter. And when we look at the different components, we can see that trade disruption has played a big role. So looking at the negative contributors, net exports was the biggest negative contributor. Why?
Because we saw a lot more imports coming into The US than has been exported and therefore a front running of imports is happening to ensure that these imports don’t get hit by the tariffs. That’s caused the big negative, in terms of GDP growth. We also saw that private residential investment was negative, which reflects a weak consumer backdrop. On the positive side we had inventory build up running quite strong. We had personal consumption also doing fairly well and we also saw that business investment has done a little bit better.
Now all three of these has also been driven and been influenced by front running. Inventory build up as wholesale retailers believe they need to bring in product before it gets hit by the tariffs. Business investment, also front running investment. And also on the consumption front, we saw that although personal consumption was positive, it has been the weakest in seven quarters, and a lot of the personal consumption has been supported by auto, auto sales, which is also due to front running. Overall, we think that there’s a lot of disruption in these numbers and that it still bodes, poorly for coming quarters as tight policy setting and uncertain policy and disruptive policy setting will continue to weigh on growth.
We also see that, the Fed chair Powell in the recent FOMC meeting said that policy is in a good place, that they can afford to wait and see how the economy will pan out before they react. So they’ve kept rates at four and a half percent, which means that the overall policy setting remains fairly tight. You also mentioned that there is a difference between the hard data and the soft data. And while the soft data, which is often the surveys, has weakened quite substantially, the hard data, which reflects the actual activity, has remained fairly robust. Now we believe it’s just a matter of time before the hard data will also roll over because typically soft data leads the hard data.
China has also been hit bad by this trade war. If we look at the high frequency trade data, we saw that while in April it holds up fairly well, towards the April you saw weakening in trade activity and also if you look at the surveys of economic activity for this month we saw also a slight weakening. So as promised the Chinese authorities came in and introduced some support measures. Just this week, they cut the policy rate by 10 basis points. They cut the reserve requirement ratio by half a percent, which means that will bring in another, trillion RMB in liquidity back into the economy.
They’ve also increased the relaying program to several sectors. They’ve increased that to by 1,100,000,000,000.0 RMB and also brought in measures to support capital markets as well as the property sector. So we continue to see that the Chinese is willing and able to support the economy against this trade war. And this ultimately is good for emerging markets. But there are other factors also that’s playing out at the moment that’s good for emerging markets.
And in particular, we saw that the oil price continues to fall. The oil price dropped from about $80 earlier this year to $60 more recently. So the reason behind this drop in the oil price is, one, because of a weaker global growth outlook. The IMF recently reset or downgraded the global growth outlook to 2.8%. That is from an average of around three and a half percent for the last five years.
And also OPEC plus has come in, and they said they will be reducing the production cuts. They anticipate a 400,000 barrels per day increase of production in May and another 400,000 in June. So bringing supply back into the market to potentially win market share again and driving down the oil price. With the low oil price, it’s also good for South Africa. And even before the full oil price drop has been factored in, the recent inflation print came out at 2.7%.
So head down inflation, the latest reading was 2.7% which is now below the 3% lower band of the target range. If you look at the different components within that drop, it has been broad based, which means that it’s a weak economic environment as well as an overall tight policy setting that is causing inflation to be running as low as it is, and therefore there is scope for the SARP to to cut interest rates. So as weak as growth, oil prices coming down, inflation is falling, inflation expectations is falling, the rand is holding up fairly well and we saw that the VAT hike was scrapped, which we think means that the scope for the SARB to cut interest rates at their meeting on the May 29. And we believe after this cut, they will continue to cut throughout the rest of the year. We could potentially get between two and four cuts over the next twelve months from the SARB.
So finally, while we believe the reduction in trade tensions is positive for global markets, we believe that we still want to be cautious on The US front and see more opportunities on the emerging market front, where lower inflation means that there’s more scope to ease policy, where the oil price is lower, helping consumption in in those emerging markets, and also where a weaker US dollar is benefiting emerging markets. Thank you for watching.
FAIRTREE INSIGHTS
You may also be interested in
Explore more commentaries from our thought leaders, offering in-depth analysis, market trends and expert analysis.
Macro Pulse Episode 21
In this episode Jacobus discusses SA equities, SA bonds and the appreciating of the US dollar.
Fairtree Market Insights with Karena Naidu | Episode 8
In this episode, we dive into our Chinese exposure, exploring what’s happening with the major e-commerce players in China. We also take a closer look at the broader emerging markets space, unpacking key trends and where we’re seeing potential growth.
Macro Pulse Episode 20
In this episode, Jacobus discusses major events leading up to year-end, recent US court cases, and the rise in long bond yields.
Leo Matthysen | Proud Partner

Transcript
Topics
FAIRTREE INSIGHTS
You may also be interested in
Explore more commentaries from our thought leaders, offering in-depth analysis, market trends and expert analysis.

Bloemhof Fairtree U16 Hockey Tournament
Fairtree is proud to be the official sponsor of Bloemhof Hockey and the title sponsor of the Bloemhof Fairtree U16 Hockey Tournament, a celebration of rising talent, teamwork and sportsmanship.